Database Reference
In-Depth Information
Z-Axis (×10^-6)
px
(×10^9)
x
(×10^-6)
y
(×10^-6)
pz
(×10^9)
z
(×10^-6)
X-Axis (×10^-6)
py
(×10^9)
0
-10
-20-30
id
20
10
535
540
545
550
555
560
565
30
6
30
30
80
30
3.0
565
0.520
4
70
20
20
20
2.0
560
60
10
10
2
0.515
10
1.0
555
50
0
0
0
Y-Axis (×10^-6)
0.0
550
0
40
0.510
-10
-10
30
-1.0
-10
545
-2
20
-20
-20
0.505
-20
-2.0
Y
Y
540
10
-4
-30
-30
X
-30
Z
Z
X
-3.0
535
(a)
(b)
(c)
=
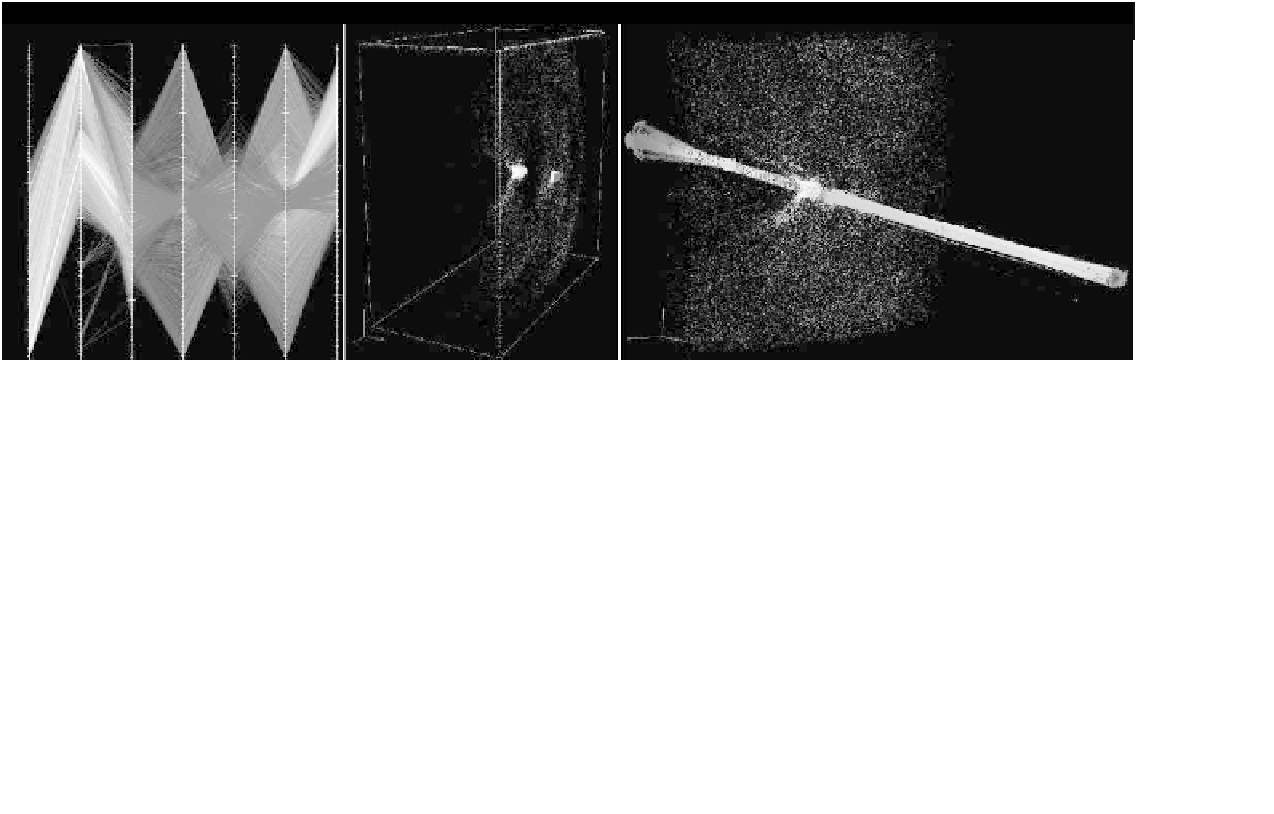
Figure 9.12
(See color insert following page 224.) (a) Parallel coordinates of timestep
t
12 of the 3D dataset. Context
view (gray) shows particles selected with
px
>
2
∗
10
9
. The focus view (red) consists of particles selected with
px
>
4
.
856
∗
10
10
10
−
4
, which indicates particles forming a compact beam in the first wake period following the laser pulse.
(b) Pseudocolor plot of the context and focus particles. (c) Traces of the beam. We selected particles at timestep
t
&&
x
>
5
.
649
∗
=
12,
then traced the particles back in time to timestep
t
9 when most of the selected particles entered the simulation window.
We also trace the particles forward in time to timestep
t
=
14. In this image, we use color to indicate
px
. In addition to the
traces and the position of the particles, we also show the context particles at timestep
t
=
12 in gray to illustrate where the
original selection was performed. We can see that the selected particles are constantly accelerated over time (increase in
px
)
since their colors range from blue (relatively low levels of
px
) to red (relatively high levels of
px
) as they move along
x
over
time.
=