Geoscience Reference
In-Depth Information
1.00
1.00
0.90
0.90
0.80
0.80
0.70
0.70
0.60
0.60
0.50
0.50
0.40
0.40
0.30
0.30
0.20
0.20
0.10
0.10
A
B
0.00
0.00
0
120140
Canopy Height (cm)
20
40
60
80
100
0
20 40 60 80 100120
Canopy Height (cm)
140
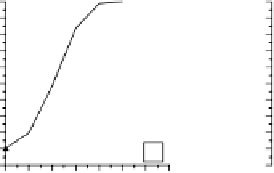
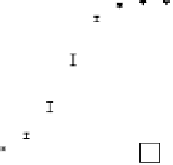
Figure 5.9
Aggregate light attenuation profiles of a
Juncus roemerians
marsh associated with PAR collections
at different sun zenith angles the first year on [
] 25 September, the second year on [
] 29 April
and [
]
22 September (1994) (A) without normalization and (B) with normalization of PAR recordings to a
nadir collection.
] 17 September, the third year on [
✴
] 13 January and [
] 24 June, and the final year on [
—
occupation times completely aligned. The latest occupation indicated a limit to the correction. Sun
zenith angles higher than about 60
overcorrected the rate of PAR fall-off through the canopy. This
led to excluding PAR canopy penetration measurements to times when the sun zenith was at least
60
∞
or higher.
A second example shows the application of the correction to PAR profile measurements during
nearly 3 years of occupations (Figure 5.9A and Figure 5.9B). The Juncus R. site was recovering
from a burn when the first occupation occurred in September. Occupations then followed chrono-
logically in April, September, January, June, and, finally, in September, 2 years after the initial
occupation. Inspection of the two plot series shows the consistency and accuracy resulting from
the application of the sun zenith correction factor. In contrast to the uncorrected plot series, the
corrected canopy PAR attenuation profiles became increasingly steep and reached lower levels of
PAR with time-since-burn.
The third example shows a series of PAR attenuation profiles created from measurements
collected at a Spartina A. site during 1 year and 9 months of site occupations beginning in February
(Figures 5.10A and B). The corrected and uncorrected series are dramatically different. After
February, the site occupations chronologically occurred in April, July, September, November, and
March, and again in September in the following year. The July occupation took place about 1
month before a hurricane affected this site (August 26), and the first September occupation occurred
about 10 days after the hurricane. The canopy light attenuation profile deepened each occupation
before the hurricane, but consistent with the effect of the hurricane, the attenuation profile shallowed
sharply immediately after the impact. PAR attenuation profiles changed little for a year after the
dramatic change in September.
∞
1.00
1.00
0.90
0.90
0.80
0.80
0.70
0.70
0.60
0.60
0.50
0.50
0.40
0.40
0.30
0.30
0.20
0.20
0.10
A
0.10
B
0.00
0.00
0
20 40 60 80 100120140
0
20 40 60 80 100120140
Canopy Height (cm)
Canopy Height (cm)
Figure 5.10
Aggregate light attenuation profiles of a
Spartina alterniflora
marsh associated with PAR collections
at different sun zenith angles on [
✙
] 16 February, [
] 26 April, [
] 10 July, [
] 4 September, and
[
] 2 September (A) without normalization
and (B) with normalization of PAR recordings to a nadir collection.
✴
] 3 November and the following year on [
] 9 March and [
—


