Geoscience Reference
In-Depth Information
A
B
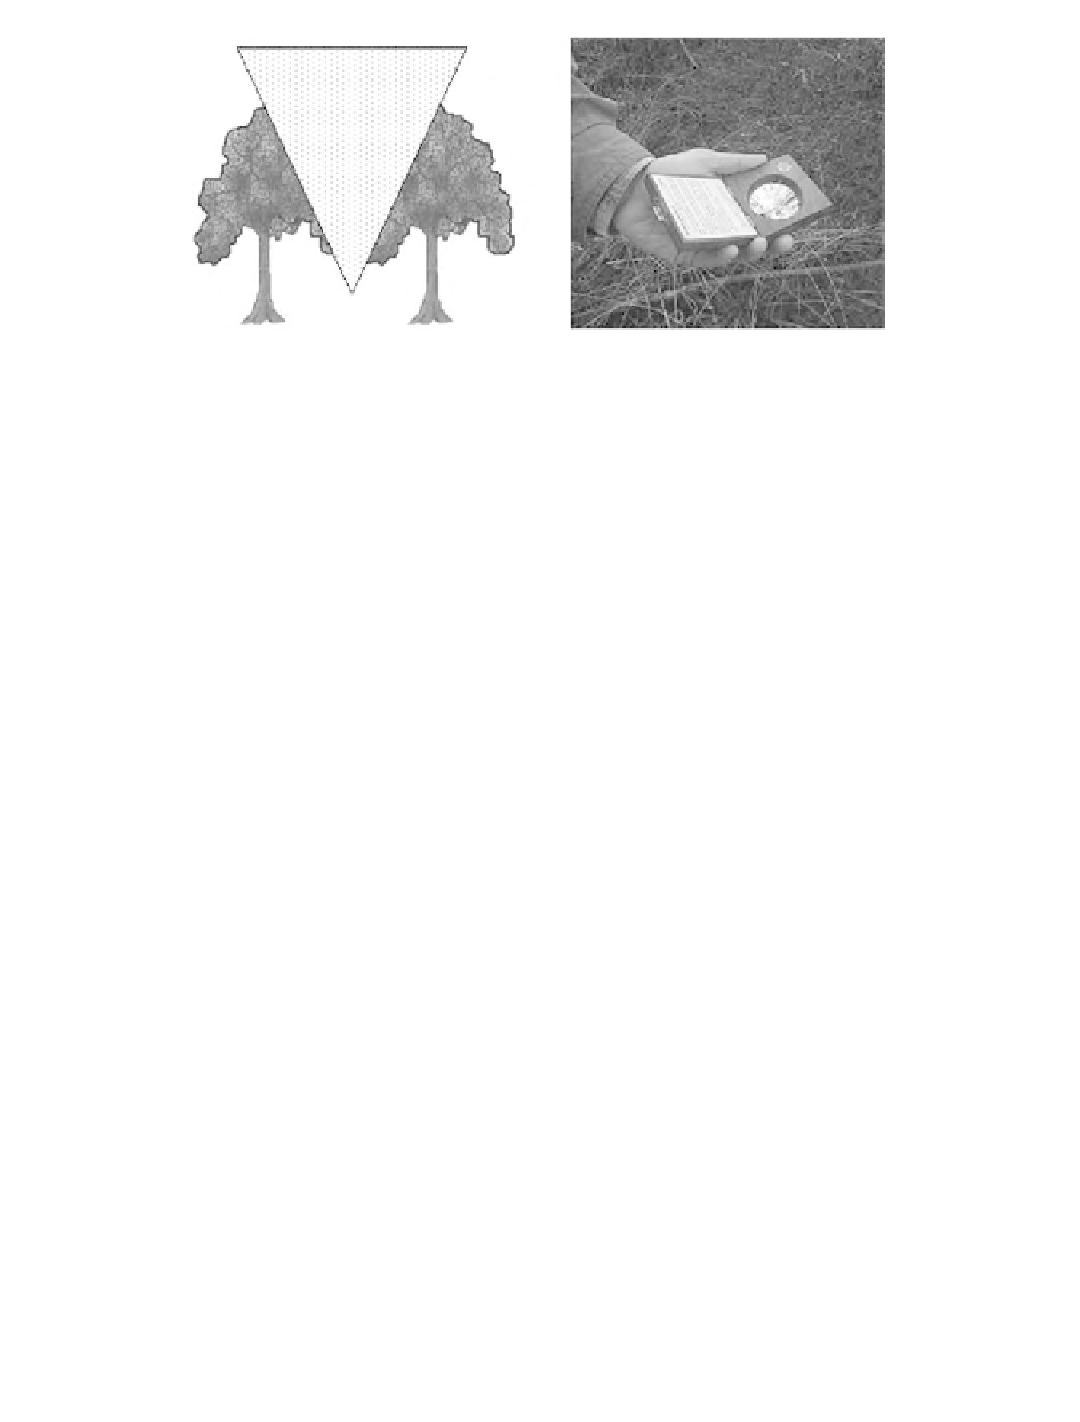
Figure 4.9
Illustration of (A) a spherical densiometer 60˚ field of view and (B) convex spherical densiometer
(courtesy of Ben Meadows).
Table 4.2
Vegetation Summary for Six Validation Sites in the Albemarle-Pamlico Basin
Under
TPH
Avg. Ht
(m)
Avg. dbh
(cm)
CC%
Dom
CC%
Sup
BA/H
(m
Site
Type
%
Over TPH
/ha)
2
Appomattox
Pine
25
1250
3790
15.9
21.6
71
34
36.7
Hardwood
25
1255
—
21.3
24.3
—— 22.9
Pine-Thinned
50
313
—
16.9
23.2
—— 11.5
Duke
Hardwood
30
——— ————
Fairystone
Hardwood
100
725-1190
—
15.5-19.5
8.5-11.5
——12.6-13.1
Hertford
Pine
100
1740
2830
14.3
18.5
71
29
37.3
South Hill
Pine
100
——— ————
Umstead
Pine
30
——— ————
Hardwood
70
——— ————
Note:
Over TPH = trees per hectare for trees greater than 5.08 cm dbh; Under TPH = trees per hectare less
than 5.08 cm in dbh; Avg. Ht = average height; Avg dbh = average diameter at breast height; CC% Dom
= crown closure for dominant crown class determined by vertical tube method; CC% Sup = crown closure
for suppressed crown class determined by fixed radius plot method; BA/H = basal area per hectare.
quadrant and subplot by recording slope, aspect, elevation, and soil type. Digital images were
recorded at the zero-meter station of each TRAC transect during each site visit for visual documen-
tation. Images were collected at 0˚, 45˚, and 90˚ from horizontal facing east along the transect line.
4.3.3
TRAC Measurements
The TRAC instrument was hand-carried at waist height (~ 1 to 1.5 m) along each transect at
a constant speed of 0.3 m/sec. The operator traversed 10 m between survey stakes in 30 sec,
monitoring speed by wristwatch. The spatial sampling interval at 32 Hz at a cruising speed of 0.3
m/sec was approximately 10 mm (i.e., 100 samples/m). To the degree possible, transects were
sampled during the time of day at which the solar azimuth was most perpendicular to the transect
azimuth. Normally, quadrants were traversed in an east-west direction, but if the solar azimuth at
the time of TRAC sampling was near 90˚ or 270˚
(early morning or late afternoon in summer),
quadrants were traversed on a north-south alignment.
PPFD measurements were made in an open area before and after the undercanopy data acqui-
sition for data normalization to the maximum solar input. Generally, large canopy gaps provided
an approximation of the above-canopy PPFD, used to define the above canopy solar flux at times
when access to open areas was limited. Under uniform sky conditions, above-canopy solar flux