Geoscience Reference
In-Depth Information
N
θ
N
W
E
W
E
r
α
S
S
A
B
Figure 4.4
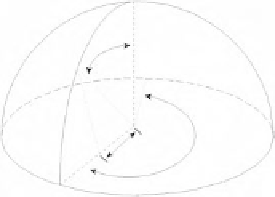
Illustration of (A) a hemispherical coordinate system. Such a system is used to convert a hemi-
spherical photograph into a two-dimensional circular image (B), where the zenith () is in the center,
the horizon at the periphery, east is to the left, and west is to the right. In a equiangular hemispherical
projection, distance along a radius (r) is proportional to zenith angle (Rich, 1990).
The TRAC manual (Leblanc et al., 2002) lists the following as studies validating the TRAC
instrument and approach: Chen and Cihlar (1995), Chen (1996), Chen et al. (1997), Kucharik et
al. (1997), and Leblanc (2002). TRAC results were compared with direct destructive sampling,
which is generally regarded as the most accurate sampling technique.
4.2.2
Hemispherical Photography Measurements
Hemispherical photography is an indirect optical method that has been used in studies of forest
light transmission and canopy structure. Photographs taken upward from the forest floor with a
180˚ hemispherical (fish-eye) lens produce circular images that record the size, shape, and location
of gaps in the forest overstory. Photographs can be taken using 35-mm film cameras or digital
cameras. A properly classified fish-eye photograph provides a detailed map of sky visibility and
obstructions (sky map) relative to the location where the photograph was taken. Various software
programs, such as Gap Light Analyzer (GLA), were available to process film or digital fish-eye
camera images into a myriad of metrics that reveal information about the light regimes beneath
the canopy and the productivity of the plant canopy. These programs rely on an accurate projection
of a three-dimensional hemispherical coordinate system onto a two-dimensional surface (Figure
4.4). Accurate projection requires calibration information for the fish-eye lens that is used and any
spherical distortions associated with the lens. GLA used in this analysis was available for download
at http://www.ecostudies.org/gla/ (Frazer et al., 1999).
The calculation of canopy metrics depends on accurate measures of gap fraction as a function
of zenith angle and azimuth. The digital image can be divided into zenith and azimuth “sky
addresses” or sectors (Figure 4.5). Each sector can be described by a combined zenith angle and
azimuth value. Within a given sector, gap fraction is calculated with values between zero (totally
“obscured” sky) and one (totally “open” sky) and is defined as the proportion of unobscured sky
as seen from a position beneath the plant canopy (Delta-T Devices, 1998).
4.2.3
Combining TRAC and Hemispherical Photography
LAI calculated using hemispherical photography or other indirect optical methods does not
account for the nonrandomness of canopy foliage elements. Hence, the term
effective leaf area index
(L
) is used to refer to the leaf area index estimated from optical measurements including hemi-
spherical photography. L
e
typically underestimates “true” LAI (Chen et al., 1991). This underesti-
mation is due in part to nonrandomness in the canopy (i.e., foliage “clumping” at the scales of tree
e