Geoscience Reference
In-Depth Information
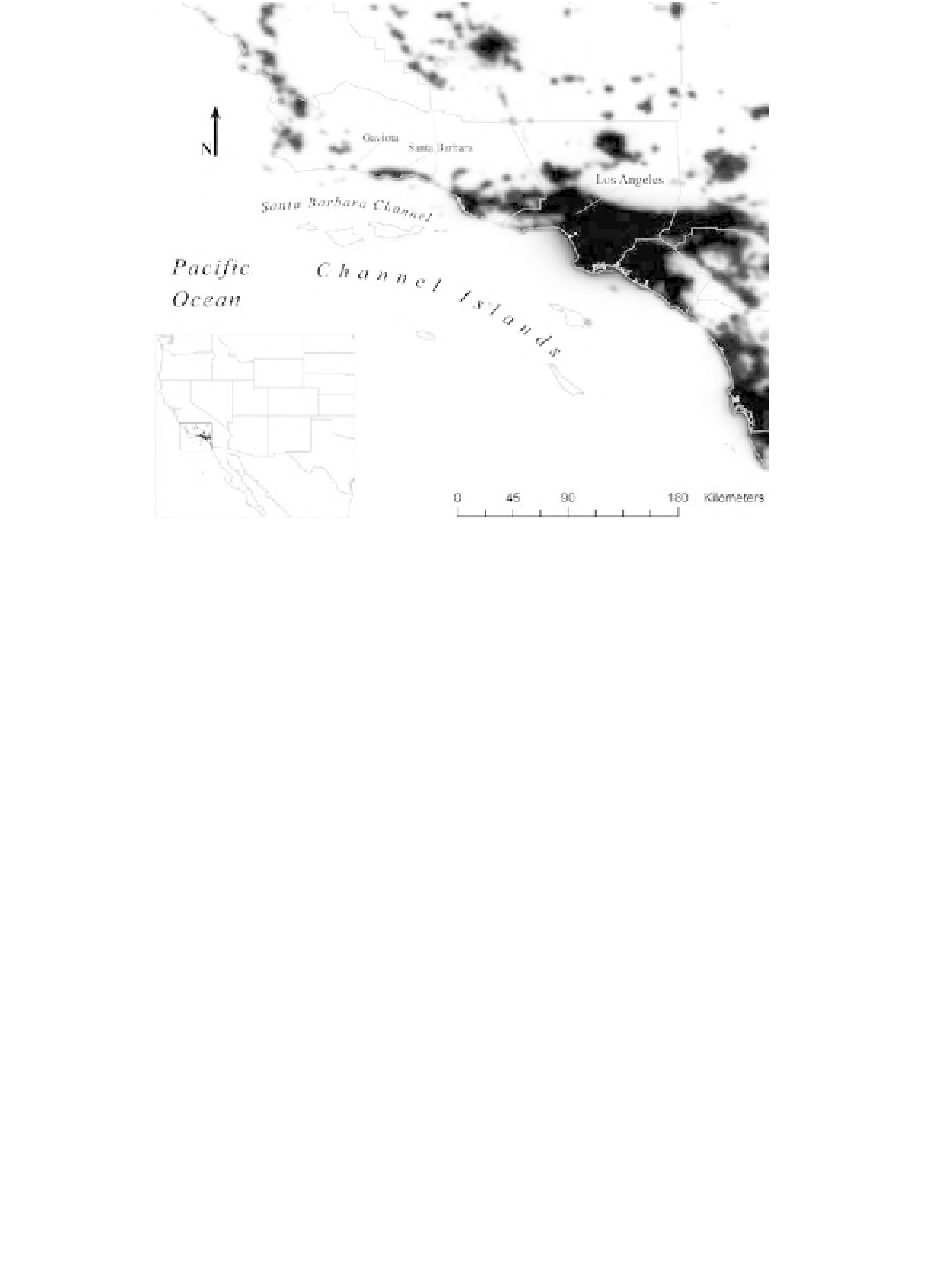
Figure 20.5
Image indicating the number of time lights were detected for each 30 arc second grid cell.
The area of each of the lighting sources was estimated using Landsat Enhanced Thematic
Mapper plus (ETM
) data from 2000 by manually drawing a polygon around each of the targets
using ENVI software. The number of ETM
+
pixels in the polygon was then multiplied by the pixel
+
area to estimate the total target size (km
). For the point sources lights, locations and area estimates
were performed using the 15-m panchromatic data. Area extraction for the onshore targets was
based on visual interpretation of an ETM
2
color composite formed using bands 2, 4, and 5 as blue,
+
color composite was individually contrast-enhanced for each target prior
to the manual polygon generation.
green, and red. The ETM
+
20.3 RESULTS
20.3.1
Geolocation Accuracy
Light detections of the point sources from individual suborbits in the time series were examined
to determine the geolocation accuracy of OLS nighttime visible band data. The latitude/longitude
locations of the five point sources of light were extracted for the center of each feature using the
15-m panchromatic ETM
data. Vector shorelines were overlain on the panchromatic data to
confirm that the geolocation accuracy of the ETM
+
data was in the range of ± one or two pixels.
This was deemed fully adequate for use as a geolocation accuracy reference source for the 2.7-km
GSD OLS data.
We followed the geolocation accuracy assessment procedures outlined by the U.S. Federal
Geographic Data Committee (FGDC, 1998). This procedure used the root-mean-square error
(RMSE) to estimate positional accuracy. RMSE was calculated as the square root of the average
of the set of squared differences between data set coordinate values and coordinate values from an
independent source of higher accuracy for identical points.
+