Geoscience Reference
In-Depth Information
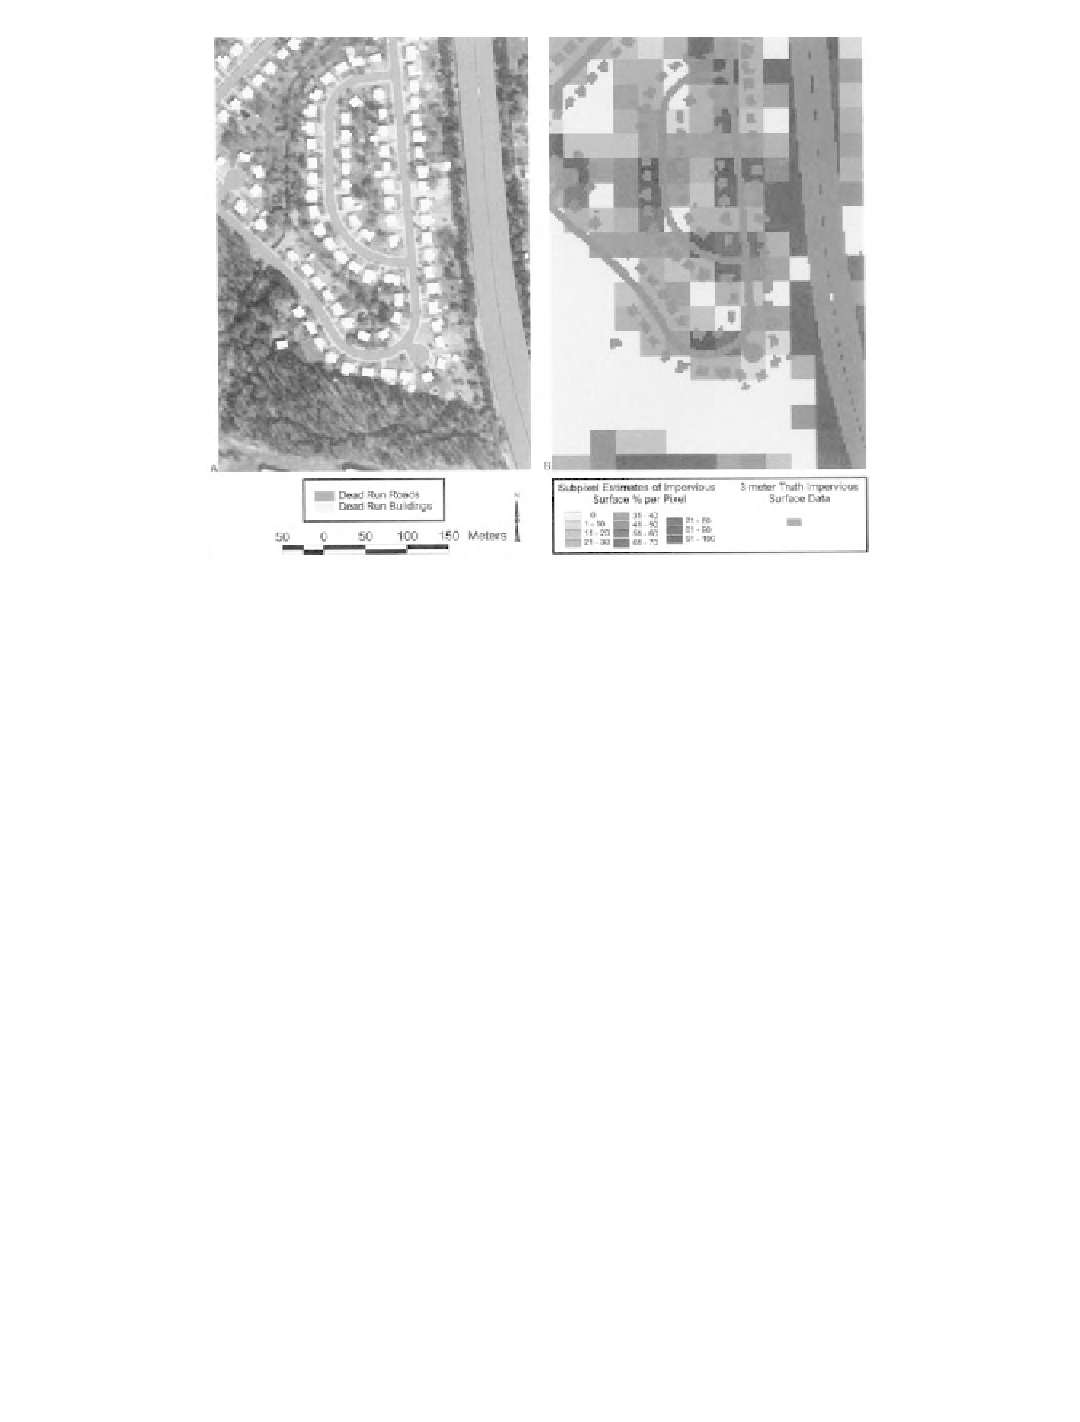
(See color insert following page 114.) An approximately 15-ha portion of the Dead Run subwater-
shed showing (a) truth vector file (roads and rooftops) overlain on a USGS DOQQ and (b) rasterized 3-m
reference GRID overlain on the 30-m subpixel estimate grid.
Plate 19.1
•
A vector point file was created based on the Dead Run cell centroids. Table 19.2 summarizes the
percentage of impervious reference data (REFERENCE_IS%) and associated subpixel impervious
surface estimate (SUBPIXEL_IS%) for each Dead Run cell record. Reference data were “rounded
up” to coincide with the subpixel estimate class structure implemented by the Mid-Atlantic RESAC
(1-10 = 10, 11-20 = 20, etc.). Table 19.2 was used to derive per-pixel or aggregate watershed
error assessment statistics.
19.2.4
Statistical Processing
We tested the overall classification accuracy of the subpixel derived impervious surface estimates
by comparing “per-pixel” measures of accuracy with whole-area measures of accuracy for a series
of simple random samples (with replacement). A range of sample sizes corresponding to various
unit areas were utilized to determine whether the calculated accuracies were dependent on sample
size. Sample sizes ranged from the entire Dead Run watershed (15,651 pixels) to simple random
samples of 225 pixels. We wanted to achieve an absolute ± 95% confidence interval of < 5% and
found that six replicates per unit area provided that level of accuracy for every sample size except
the smallest. Given the incomplete nature of the planimetric truth data set, a more rigorous sampling
scheme was considered to be unnecessary. To explore the issue of spatial autocorrelation of subpixel
classified imagery, we sampled a series of discrete pixel blocks without replacement and compared
“per-pixel” measures of accuracy with whole-area measures of accuracy. Six replicates per block
sizes 3
25 were used.
To assess pixel accuracy, we processed the reference and subpixel classified data within an 11-
category contingency table and calculated a per-pixel overall accuracy value and a Kappa coefficient
of agreement (Khat) value. To assess the whole-area accuracy, we compared the subpixel derived
impervious estimates with the reference data estimates per unit area and calculated the absolute
value of the relative error ([abs(REFERENCE_IS% - SUBPIXEL _IS%)]/(REFERENCE_IS%))
¥
3, 5
¥
5, 9
¥
9, 15
¥
15, and 25
¥