Geoscience Reference
In-Depth Information
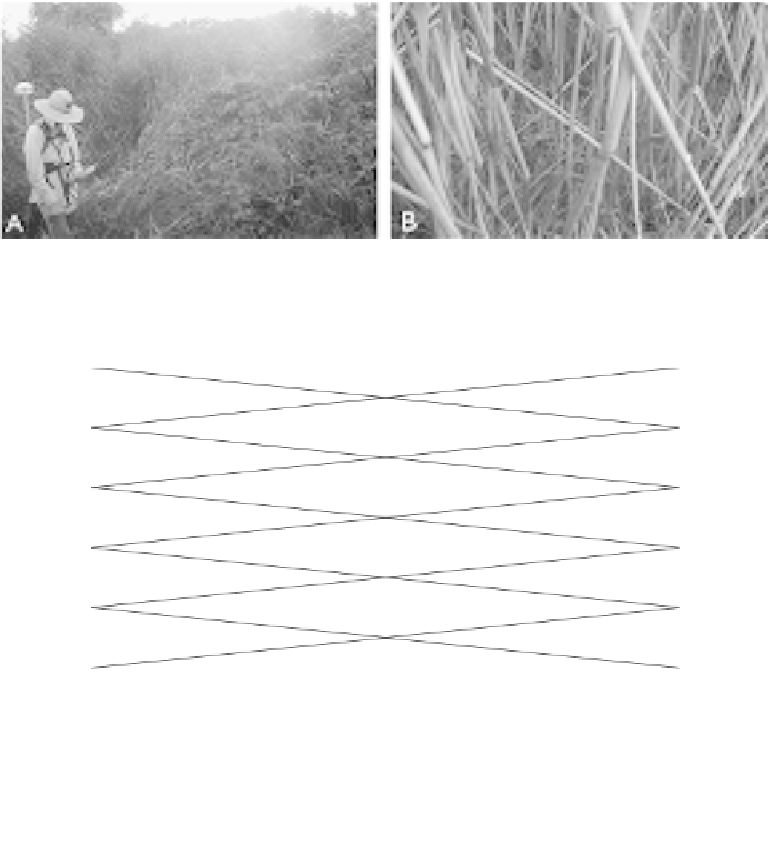
Figure 18.3
Field sampling activities were an important part of calibrating the hyperspectral data and assessing
map accuracy. (A) dense
understory layer in the
northernmost stand. The edges of the stand and the internal transects were mapped using a real-
time differential global positioning system.
Phragmites
canopy and (B) dense
Phragmites
Figure 18.4
Magnified view of northernmost field-sampled vegetation stands to the east and west of Pointe
Mouillee Road. Two methods were used to quadrat-sample vegetation stands: (a) edge and interior
was sampled if the stand was small enough to be completely traversed (left,
Phragmites
) or (b)
solely the interior was sampled if the stand was too large to be completely traversed (right,
Typha
).
This example shows a
stand that extended approximately 0.75 km east of Pointe Mouillee
Road. Thus, the field crew penetrated into the stand but did not completely traverse the stand.
Black squares = nested quadrat sample locations. Image is a grayscale reproduction of a natural-
color spatial subset of airborne ADAR data acquired August 14, 2001.
Typha
endmembers was determined based on reference data derived from the interpretation of 1999
panchromatic aerial photography and field observation data collected in 2001. Additional accuracy
checking of mapped areas of
was accomplished using ENVI Mixture Tuned Matched
Filtering (MTMF) algorithms. Visual interpretation of the MTMF “infeasibility values” (noise sigma
units) vs. “matched filtering values” (relative match to spectrum) further aided in the elimination
of potential endmembers. The matched filtering values provided a means of estimating the relative
degree of match to the
Phragmites
patch reference spectrum and the approximate subpixel abun-
dance. Correctly mapped pixels had a matched filter score above the background distribution and
Phragmites