Geoscience Reference
In-Depth Information
100
Disagreement
due to quantity
Disagreement
at stratum level
Disagreement at
substratum level
Disagreement
at grid cell level
90
80
70
Agreement at
grid cell level
Agreement at
substratum level
Agreement at
stratum level
Agreement due
to quantity
Agreement due
to chance
60
50
40
1
2
3
6
12
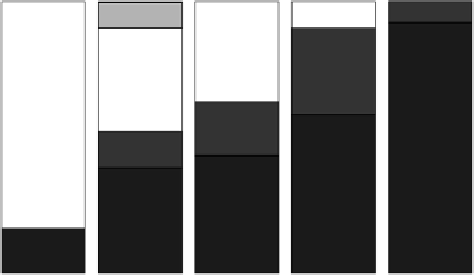
Figure 17.7
Stacked bars showing agreement between COM1 and REF. The vertical axis shows the cumulative
percentage of the total study area. The numbers on the horizontal axis give the resolutions.
100
Disagreement
due to quantity
Disagreement
at stratum level
Disagreement at
substratum level
Disagreement
at grid cell level
90
80
70
Agreement at
grid cell level
Agreement at
substratum level
Agreement at
stratum level
Agreement due
to quantity
Agreement due
to chance
60
50
40
1
2
3
6
12
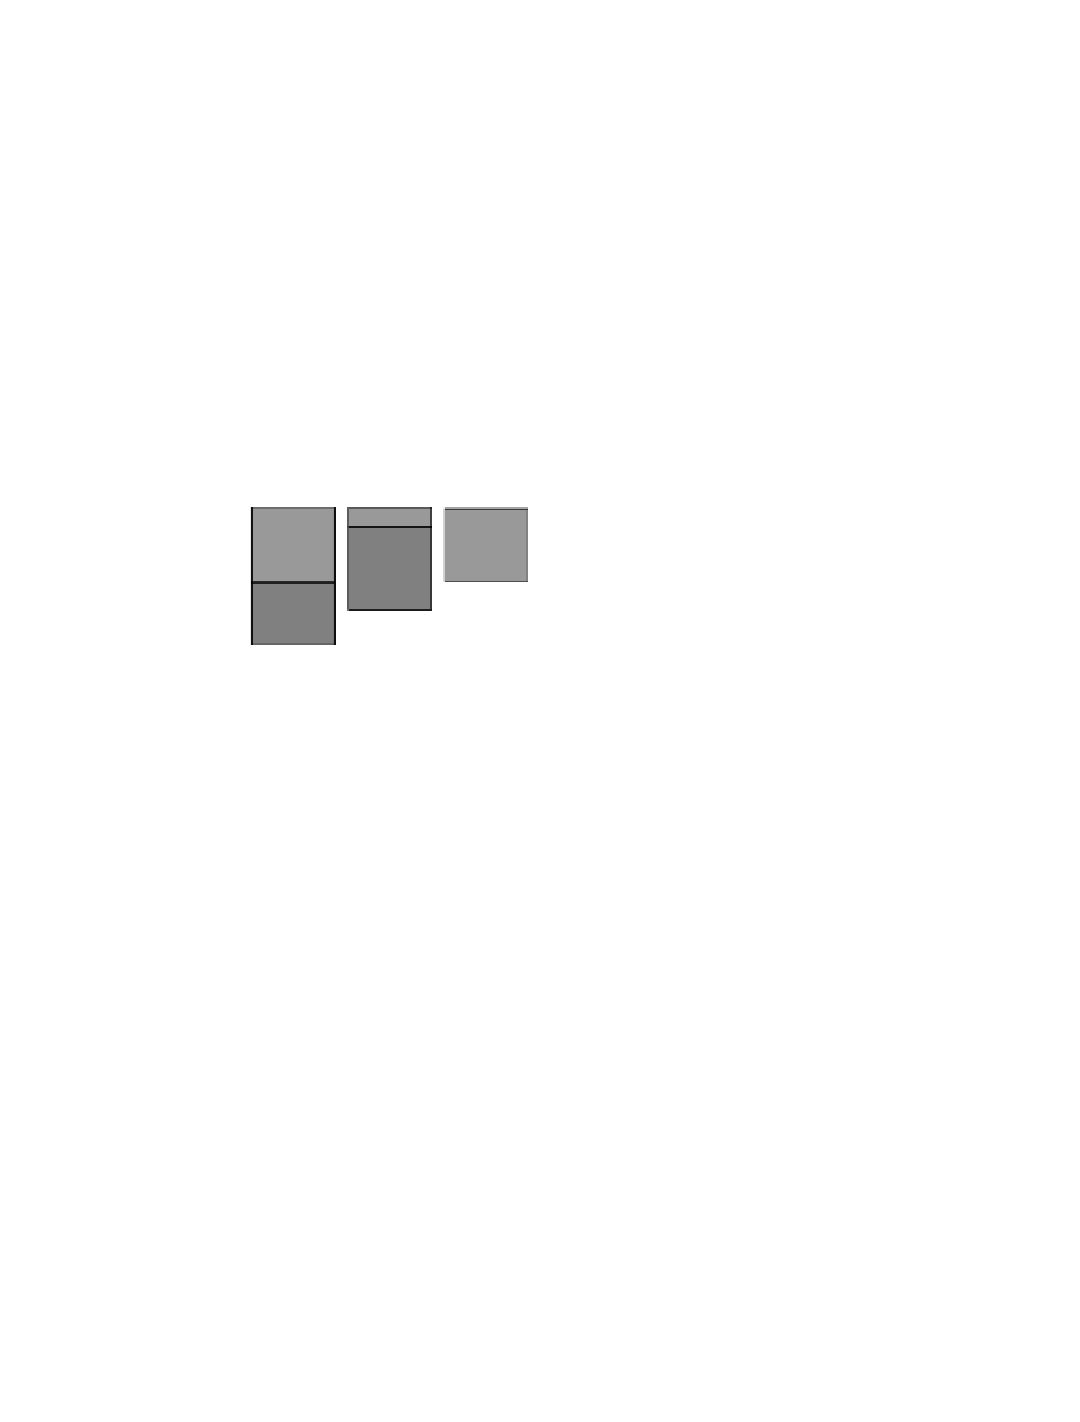
Figure 17.8
Stacked bars showing agreement between COM2 and REF. The vertical axis shows the cumulative
percentage of the total study area. The numbers on the horizontal axis give the resolutions.
cell level and disagreement at the grid cell level. As resolution becomes coarser, the grid cell level
information becomes less important, relative to information of quantity. At the coarsest resolution,
where the entire study area is in one cell, the concept of location has no meaning; hence, the only
components are agreement due to chance, agreement due to quantity, and disagreement due to
quantity. COM1 has a component of disagreement due to quantity, which does not change as
resolution changes, since quantity is a concept independent of resolution. COM2 has no disagree-
ment in quantity.
Figure 17.9 shows that at a fine resolution the agreement between COM2 and REF is greater
than the agreement between COM1 and REF. The components that account for the greater agreement
are the agreement at the stratum level and at the grid cell level.
Table 17.3 and Table 17.4 display contingency tables that show the nested stratification structure
of strata and substrata. These tables are another helpful way to present results. The information on
the diagonal indicates the number of cells for each substratum that are in agreement. Therefore,
the number of correct cells may be calculated for each substratum by summing the diagonal for
each subset of the table. Furthermore, the row and column totals indicate stratum-level agreement.
For example, Table 17.3 shows disagreement at the stratum level, since there are 31 forested cells
in COM1 vs. 35 in REF for the north stratum and there are 16 forested cells in COM1 vs. 10 in