Geoscience Reference
In-Depth Information
top of the substratum bar to produce the nested bar. Depending on the nature of the maps, the
nested bar could show nine possible components listed in the legend. In the comparison of REF
and COM1, the bar shows eight nested components.
17.2.6
Multiple Resolutions
Up to this point, our analysis of the maps of Figure 17.2 has been based on a cell-by-cell
analysis with hard classification. The advantage of cell-by-cell analysis with hard classification is
its simplicity. The disadvantage of cell-by-cell analysis with hard classification is that if a specific
cell fails to have the correct category, then it is counted as complete error, even when the correct
category is found in a neighboring cell. Therefore, cell-by-cell analysis can fail to indicate general
agreement of pattern because it fails to consider spatial proximity to agreement. In order to remedy
this problem we perform multiple resolution analysis.
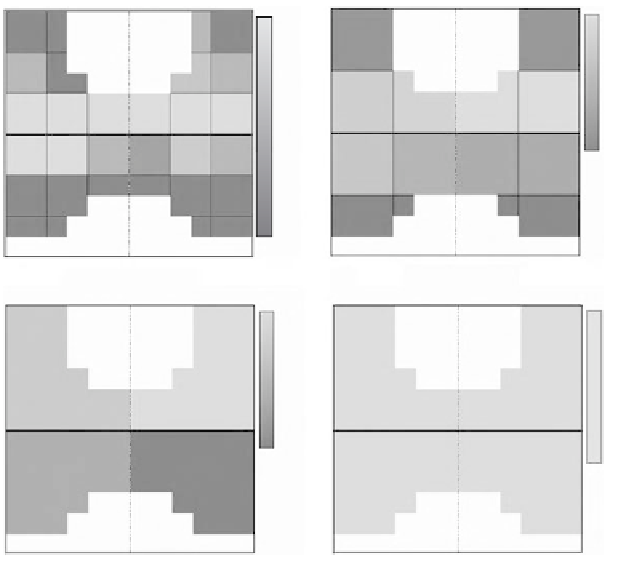
The multiple resolution analysis requires a new set of maps for each new resolution. Figure
17.2 shows maps that are hard classified, whereas Figure 17.5 shows the COM1 map at four coarser
resolutions. Each cell of each map of Figure 17.5 is an average of neighboring cells of the original
COM1 map of Figure 17.2. For example, for resolution 2, four neighboring cells become a single
coarse cell; therefore, the 12 ¥ 12 map of original cells yields a 6 ¥ 6 map. At resolution three,
we obtain a 4 ¥ 4 map of coarse cells, in which the length of the side of each coarse cell is three
times the length of the side of each original fine-resolution cell. At resolution four, we obtain a 2
¥ 2 map of coarse cells, where each coarse cell is its own substratum. At resolution 12, the entire
map is in one cell. For each coarse cell, the membership in each category is the average of the
memberships of the contributing cells. When using this aggregation technique, the lack of a square
study area can result in an unequal number of fine-resolution cells in each of the coarser cells. This
0.00
0.06
0.13
0.19
0.25
0.31
0.38
0.44
0.50
0.56
0.63
0.69
0.75
0.81
0.88
0.94
1.00
0.00
0.06
0.13
0.19
0.25
0.31
0.38
0.44
0.50
0.56
0.63
0.69
0.75
0.81
0.88
0.94
1.00
RESOLUTION 2
RESOLUTION 3
0.32
0.35
0.37
0.40
0.43
0.45
0.48
0.51
0.54
0.57
0.59
0.62
0.65
0.68
0.70
0.73
0.76
0.74
0.74
0.74
0.74
0.74
0.74
0.74
0.74
0.74
0.74
0.74
0.74
0.74
0.74
0.74
0.74
0.74
RESOLUTION 6
RESOLUTION 12
Figure 17.5
Map COM1 at four different resolutions. On the legend, 0 means completely forest, 1 means
completely nonforest, and white is outside of the study area.