Geoscience Reference
In-Depth Information
Table 17.2 Definition and Values of Seven Components of Agreement for COM1 vs. Reference Derived
from the Mathematical Expressions of Figure 17.3
Percentage of Each
Component
Stratum
Name of Component
Definition
Substratum
Disagreement due to
quantity
P(
p
) - P(
m
)
2.0
2.0
Disagreement at stratum
level
P(
m
) - K(
m
)
8.0
8.0
Disagreement at grid cell
level
K(
m
) - M(
m
)
20.0
20.0
Agreement at grid cell level
MAX [M(
m
) - H(
m
), 0]
12.2
11.5
Agreement at stratum level
If MIN [N(
m
), H(
m
), M(
m
)] = N(
m
),
then MIN [H(
m
) - N(
m
), M(
m
) - N(
m
)],
else 0
7.5
8.2
Agreement due to quantity
If MIN [N(
n
),N(
m
), H(
m
), M(
m
)] = N(
n
),
then MIN [N(
m
) - N(
n
), H(
m
) - N(
n
), M(
m
) - N(
n
)],
else 0
0.3
0.3
Agreement due to chance
MIN [N(
n
),N(
m
), H(
m
), M(
m
)]
50.0
50.0
and M(
m
). The component of agreement due to quantity is usually N(
m
) - N(
n
); Table 17.2 gives
a more general definition to account for the possibility that the comparison map's information of
quantity can be worse than no information of quantity. The component of agreement at the stratum
level is usually H(
m
) - N(
m
); Table 17.2 gives a more general definition to restrict this component
of agreement to be nonnegative. Similarly, the component of agreement at the grid cell level is
usually M(
m
) - H(
m
); Table 17.2 restricts this component of agreement to be nonnegative. Table
17.2 also defines the components of disagreement. It is a mathematical fact that M(
m
) £ K(
m
) £
P(
m
) £ P(
p
); therefore, the components of disagreement are the simple definitions of Table 17.2.
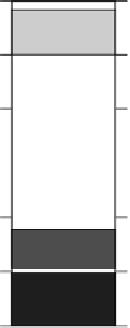
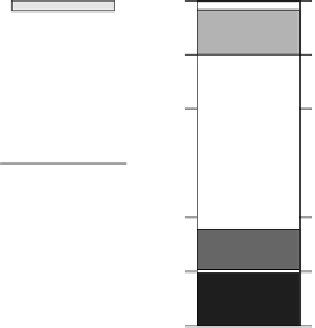
The partition of the components of agreement can be performed for any stratification structure.
Table 17.2 shows the results for the comparison of REF and COM1 at both the stratum level and
the substratum level. Figure 17.4 shows this information in graphical form. The stratum bar shows
the components at the stratum level and the substratum bar shows the components at the substratum
level. Since the substrata are nested within the strata, it makes sense to overlay the stratum bar on
100
Disagreement
due to quantity
Disagreement
at stratum level
Disagreement at
substratum level
Disagreement
at grid cell level
90
80
+
70
Agreement at
grid cell level
Agreement at
substratum level
Agreement at
stratum level
Agreement due
to quantity
Agreement due
to chance
60
50
40
Stratum
Substratum
Nested
Figure 17.4
Stacked bars showing components of agreement between COM1 and REF. The vertical axis shows
the cumulative percentage of cells in the study area. The nested bar is the stratum bar overlaid
on top of the substratum bar to show agreement at both the stratum and substratum levels. Table
17.2 gives the numerical values for the components in the stratum and substratum bars.