Geoscience Reference
In-Depth Information
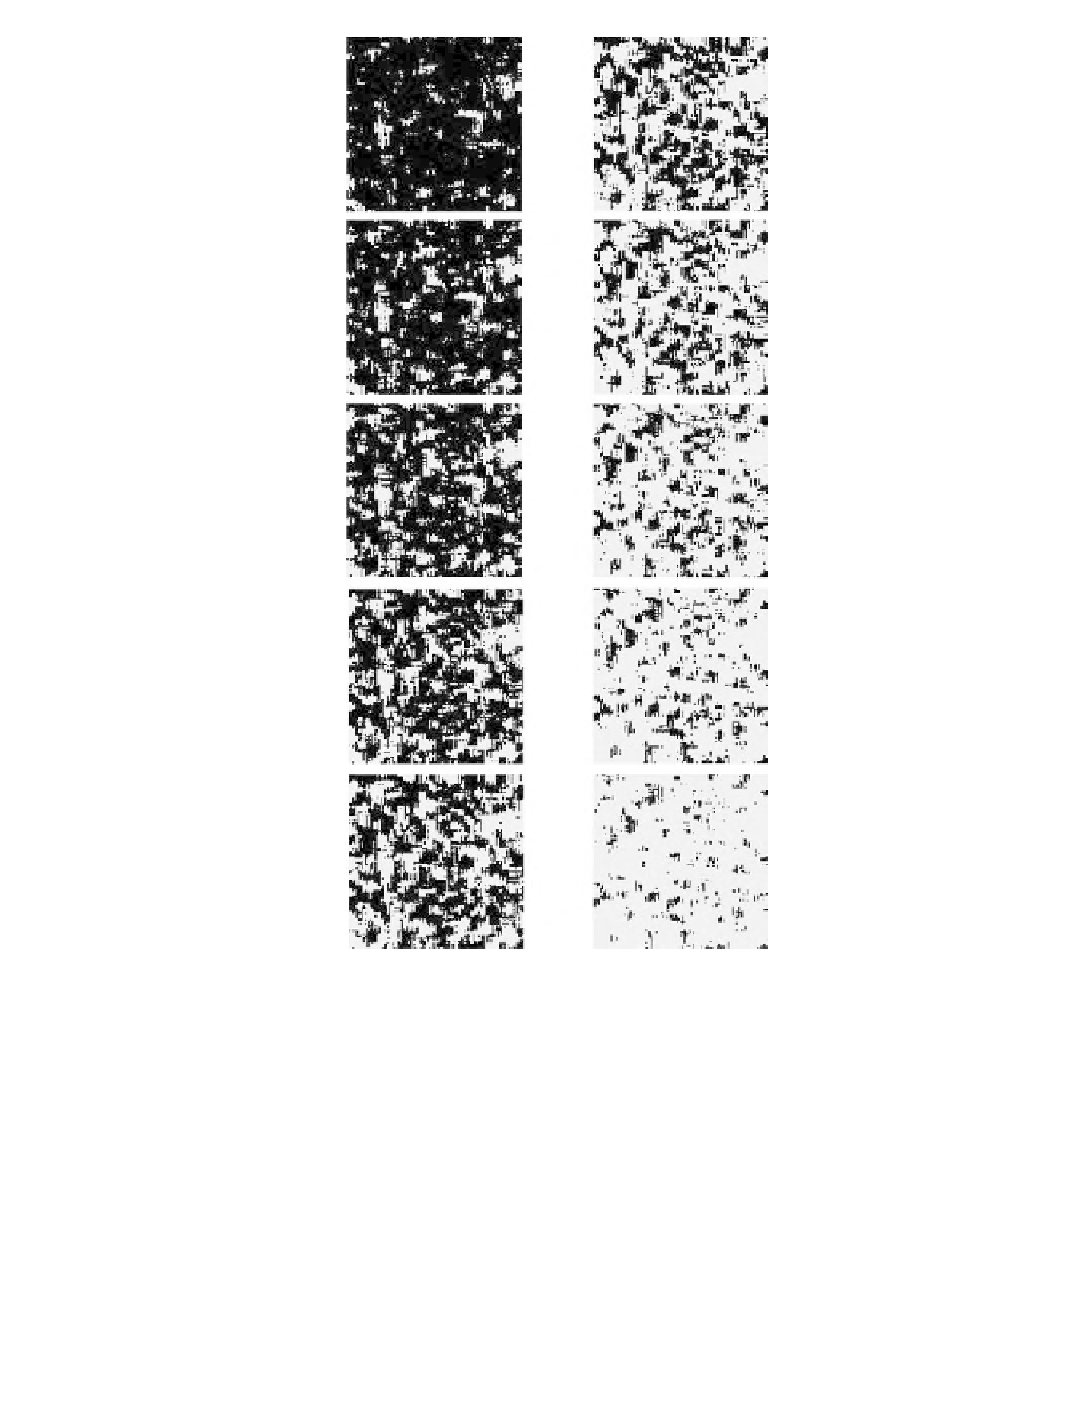
90%
45%
81%
36%
72%
27%
63%
18%
53%
9%
Figure 16.2
One of 10 realizations of landscape simulations created to illustrate the influence of the proportion
of the landscape covered by a class on the values of landscape pattern metrics. The number
indicates the percentage of the landscape in forest (shown in black).
16.4 RESULTS
16.4.1
Precision of Landscape Metrics
Comparison among the patch-based metrics indicated that the number and size of patches were
much less precise than the area of forest and the edge density (Table 16.1). A likely explanation
is that the number of patches and mean patch size metrics required that the pixel classification and
patch aggregation processes be consistent. Both of these can be sensitive to spatially patterned
classification error, thus suggesting that there are differences among metrics in the
D
precision
described in Figure 16.1.