Geoscience Reference
In-Depth Information
(a)
120
Overall
Accuracy
Producer's
Accuracy
User's
Accuracy
100
80
LA Group
IA Group
HA Group
60
40
20
0
Landscape Urban
Agriculture
Forest
Water
Urban Agriculture Forest
Water
(b)
25
Producer's
Accuracy
Overall
Accuracy
User's
Accuracy
20
LA Group
IA Group
HA Group
15
10
5
0
Landscape Urban
Agriculture
Forest
Water
Urban Agriculture Forest
Water
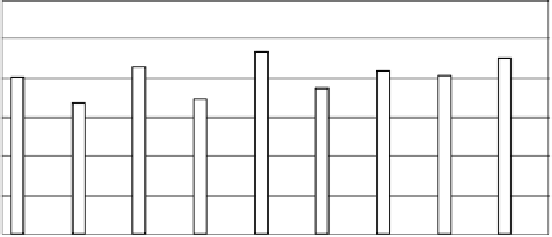
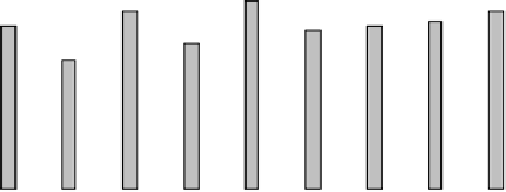
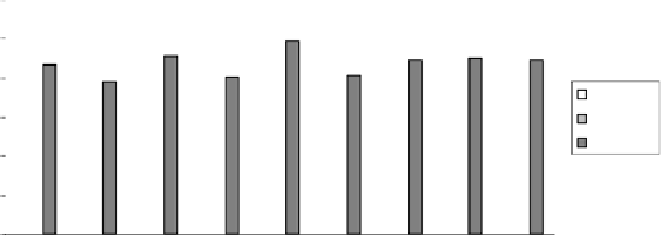
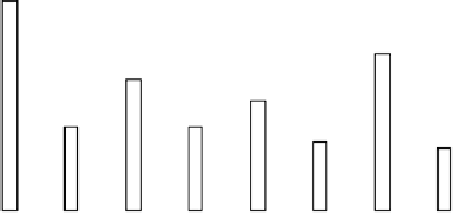
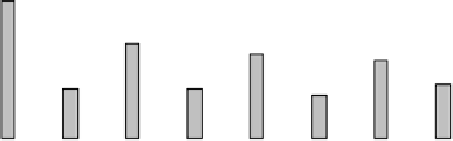
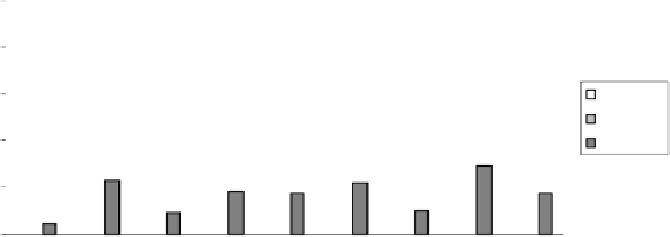
Figure 15.2
The mean (a) and standard deviation (b) values for overall and individual classification accuracies;
LA = lowest accuracy, IA = intermediate accuracy, HA = highest accuracy.
errors that have causal relationships with landscape function. Overall accuracy is the most frequently
used accuracy statistics, but it has limited control over the errors of landscape indices. In practice,
greater overall accuracy resulted in more controllable errors associated with landscape indices.
Only an unrealistic, 100% accurate map represents perfect source data for computing landscape
indices. For example, the overall accuracy of LC and LU maps derived from TM data for the eastern
U.S. was 81% for Anderson Level I (i.e., water, urban, barren land, forest, agricultural land, wetland,
and rangeland) and was 60% for Anderson Level II (Vogelmann et al., 2001). Such classification
accuracies are not high enough for ensuring reliable landscape index calculations.
Overall accuracy did not have a causal control over the variability of index accuracies. When
overall accuracy was relatively low, it also lost control over the difference between user's and
producer's accuracies. It also appeared that the uncertainties of landscape indices were more
sensitive to the variations in user's and producer's accuracies than to overall accuracy values alone.
REA values reflected the differences between user's and producer's accuracies and therefore had
a better control over the errors of landscape indices than did overall accuracy, particularly when
overall accuracy was relatively low.
Because REA is derived for assessing the accuracy of %LAND, this index alone can be
used to predict the errors of %LAND. The linear relationship with REA and the area of forested
land verifies the reliability of such predictions with REA. While the overall accuracy is approx-
imately the average of user's and producer's accuracy, REA reveals the differences between
user's and producer's accuracy. Therefore, the overall accuracy and REA explained different
aspects of classification accuracy. Although the lowest errors of landscape indices often occur
when REA is near zero, variations in the errors of landscape indices still existed. When REA
and the overall accuracy were used together, the errors of landscape indices were better predicted