Geoscience Reference
In-Depth Information
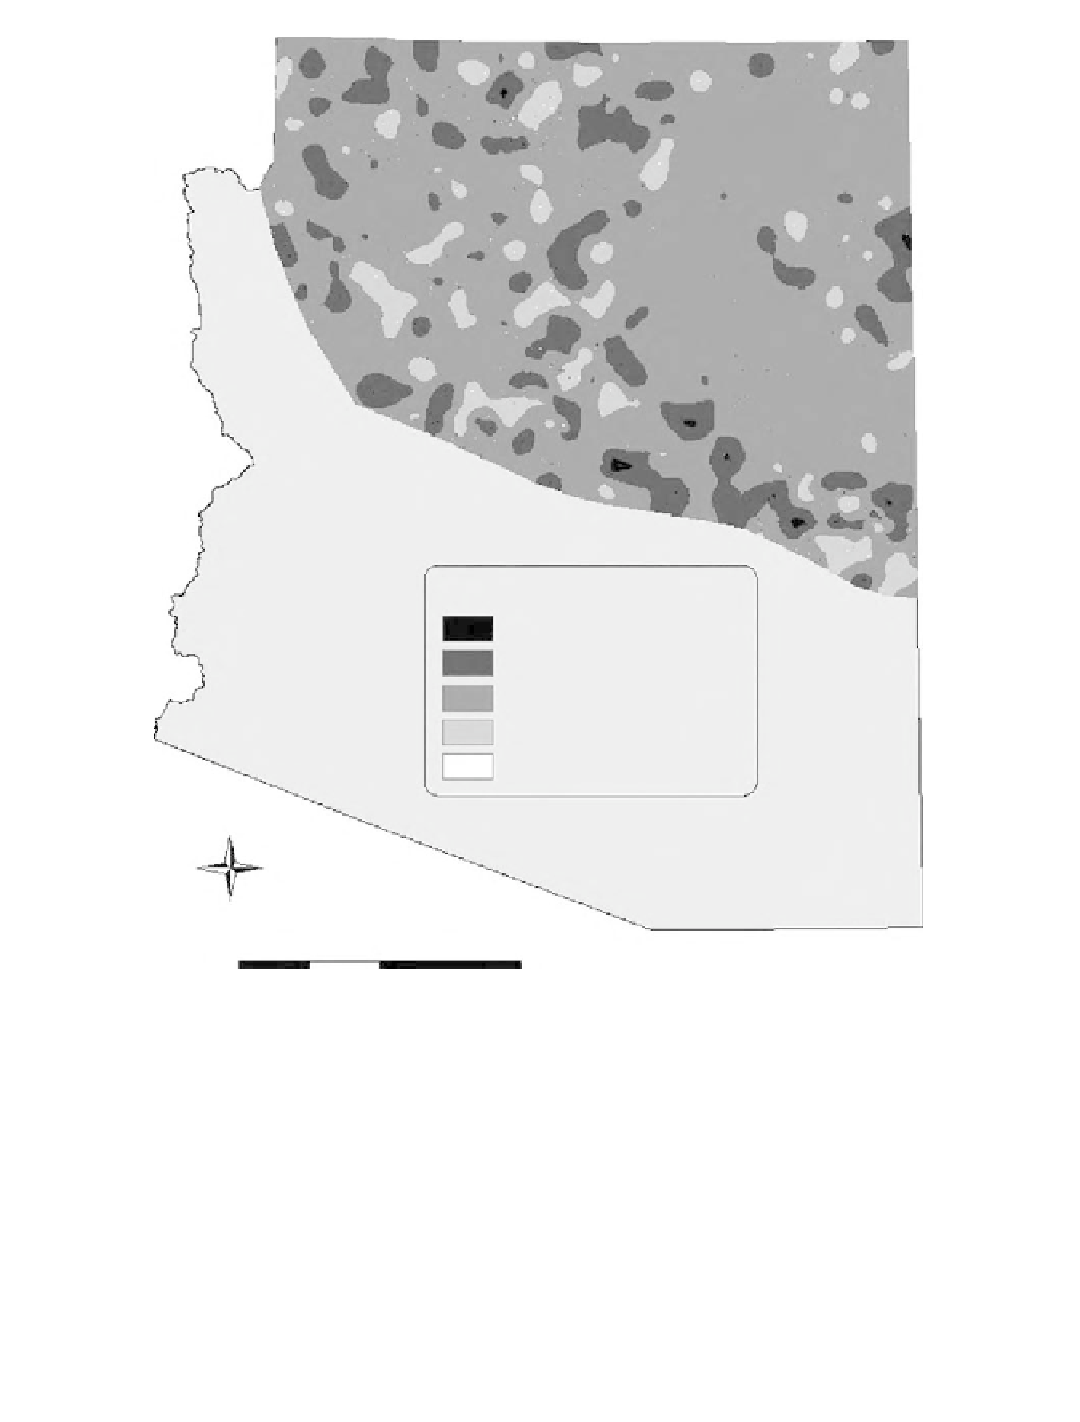
ACCURACY RANK
1 = wrong
2 = understandable but wrong
3 = reasonable or acceptable
4 = good
5 = right
N
0
50
100
200
Kilometers
Figure 14.6
Fuzzy spatial view of accuracy.
located near ground control data used in the map development tended to be more correct than
remote areas for which only imagery was used to develop the map.
The fuzzy spatial view of accuracy built upon the information produced by the fuzzy set analysis
and created a map of accuracy of the preliminary AZ-GAP LC map. Not only was accuracy
displayed as it varied across the northern Arizona landscape, but the degree of accuracy was
conveyed by accuracy ranks. Overall, the fuzzy spatial view of accuracy indicated that the LC map
was accurate to the life-form level, with locations of higher and lower accuracy. The histogram of
accuracy ranks for northern Arizona indicated that the interpolated accuracy was 85% at the life-
form level for all cover types. However, where classification required identification of the dominant
and, in some cases, associate, species, accuracy remained low (8%).