Geoscience Reference
In-Depth Information
(a)
(b)
400
400
350
350
300
300
250
250
200
200
150
150
100
100
50
50
0
50
100
150
200
250
300
350
400
450
500
0
50
100
150
200
250
300
350
400
450
500
Forest
Shrub
Rangeland
Forest
+
Shrub
Rangeland
O
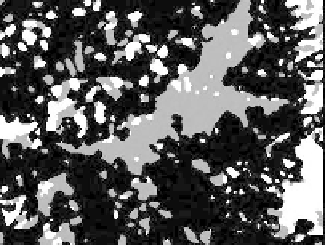
Figure 11.1
Reference classification (a) and 314 training pixels (b) selected via stratified random sampling.
Table 11.1 Parameters of the Three Indicator
Covariance Models,
s
,
s
,
s
, for Forest,
1
2
3
Shrub, and Rangeland, Respectively
Sill
Range
Nugget
(1)
(2)
(1)
(2)
Forest
0.02
0.61
0.37
30
120
Shrub
0.03
0.59
0.38
25
100
Rangeland
0.01
0.75
0.75
22
400
Note:
All indicator covariances were modeled using a
nugget contribution and two exponential cova-
riance structures with respective sills and prac-
tical ranges: sill(1), sill(2), range(1), and
range(2). Sill values are expressed as a per-
centage of the total variance:
) = 0.23,
0.17, 0.12, for forest, shrub, and rangeland,
respectively; range values are expressed in
numbers of pixels.
p
(1 -
p
k
k
tively. The remaining unsampled reference pixels were used as validation data for assessing the
accuracy of the different methods. The cropped (ranging from 7 to 530 and from 9 to 406 pixels)
reference classification and the
G =
314 training samples used in this study are shown in Figure
11.1a and Figure 11.1b.
The class labels and the corresponding simulated reflectance values at the training sample
locations were used to derive statistical parameters: the class-conditional means
and the class-conditional (co)variances for forest, shrub, and rangeland, respectively.
The class labels of the training pixels were also used to infer the three indicator covariance models,
, for forest, shrub, and rangeland, respectively (Equation 11.5). All indicator covariance
models (not shown) were isotropic, and their parameters are tabulated in Table 11.1. The forest
and shrub indicator covariance models, , consisted of a nugget component (2 to 3% of the
total variance), a small-scale structure of practical range 25 to 30 pixels (59 to 61% of the total
variance), and a larger-scale structure of practical range 100 to 120 pixels (37 to 38% of the total
variance). The rangeland indicator covariance model, , consisted of a nugget component (1%
of the total variance), a small-scale structure of practical range 22 pixels (75% of the total variance),
and one larger-scale structure of practical range 400 pixels (24% of the total variance). These
covariance model parameters imply that forest and shrub have a very similar spatial correlation
that differs slightly from that of rangeland. The latter class has more pronounced small-scale
mm m
XX X
,
,
|
1
|
2
|
3
o
o
o
SS S S
XX X
,
,
|
1
|
2
|
3
ss s s
123
,
,
ss
12
,
s
3