Geoscience Reference
In-Depth Information
Table 8.2
Distribution of Scenes for Independent Assessment
Total Number of
Scenes in Study Area
Scenes
Assessed
Scenes
Reprocessed
Scenes Meeting
Acceptance Criteria
State
New South Wales including
Australian Capital
Territory
37
10
2
9
Northern Territory
10
3
0
3
Queensland
53
22
0
22
South Australia
17
11
3
10
Tasmania
5
3
1
3
Victoria
16
9
0
9
Western Australia
18
9
1
9
Total
156
67
7
65
met the acceptance criteria (Table 8.2). Of the remaining two scenes, one contained a significant
proportion of change due to fire on rocky hillsides that was difficult to map from the image without
additional photo interpretation. The second also contained changes due to fire and the loss of native
vegetation followed by plantation establishment. These changes were difficult to detect without
local knowledge and ancillary data.
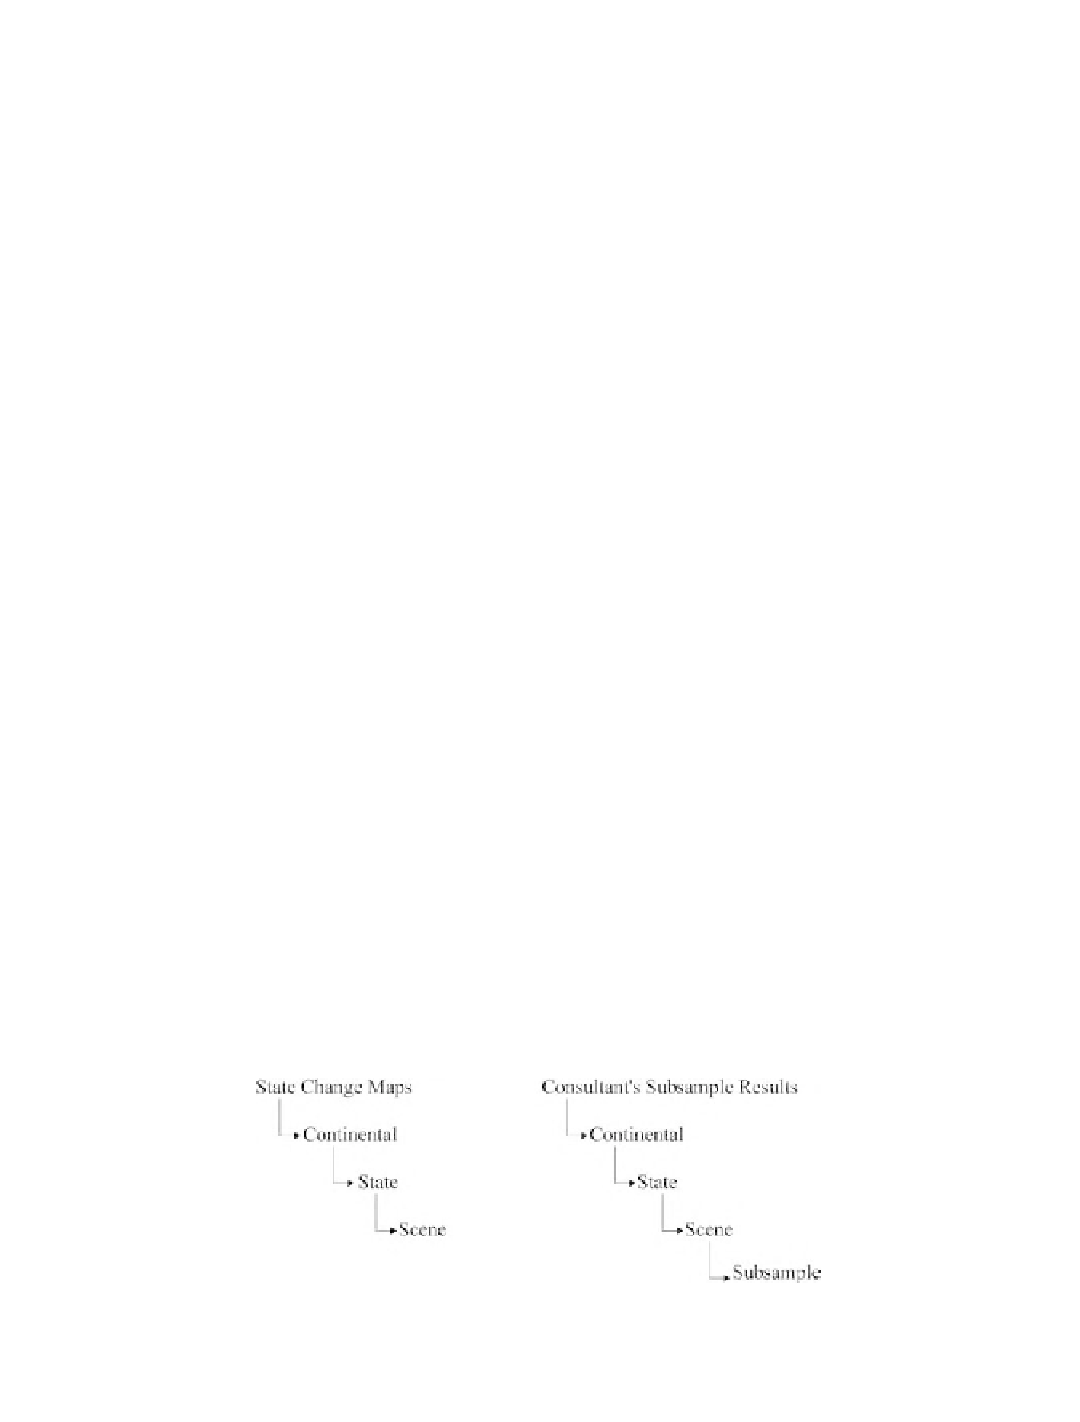
Further analyses of change maps were undertaken to estimate the variability in overall state
and continental estimates of change, and change estimates within each state. The analyst and state
results provide a spatial hierarchy in which change proportions and variability could be estimated
(Figure 8.5). The overall mean proportions and variability were estimated for the change scenes.
Approximate 95% confidence intervals for the means were calculated at each of the levels and
were used to identify any significant differences between the estimates at each of the levels. In
most cases, the mean change proportions estimated from the consultant's process provided values
well within the 95% confidence interval estimated by the states (Table 8.3). The only exceptions
were two scenes from Queensland with mean change estimates in excess of the confidence interval
estimated by the state. Although the analyst's process provided lower mean change proportion
estimates than those of the state, the two estimates of variability were generally similar. The
continental estimates were within the 95% confidence interval, although the state estimate of
continental change was 1.3% vs. the analyst's lower estimate of 0.9%. The variability of the state
estimate was lower (0.2%) than that of the estimate provided by the consultant's process (0.3%).
Table 8.4 summarizes the mean and variability of change for the spatial hierarchy. It shows that
the variability estimates from the analyst's results are greater than those from the state at comparable
levels. The ranges of means for the change proportions were consistently lower for the analyst's
results, but not statistically different. Our results indicated that the states' results were the most
accurate, as was evidenced by the relatively small confidence intervals.
Of the 67 scenes evaluated, 90% were determined acceptable after initial processing and 97%
after additional processing. This high level of acceptance provided confidence in the results of the
ALCC project. The total potential error in LC change estimates across Australia is shown in Table
Figure 8.5
Estimation hierarchy from the state's and analyst's results sets.