Geoscience Reference
In-Depth Information
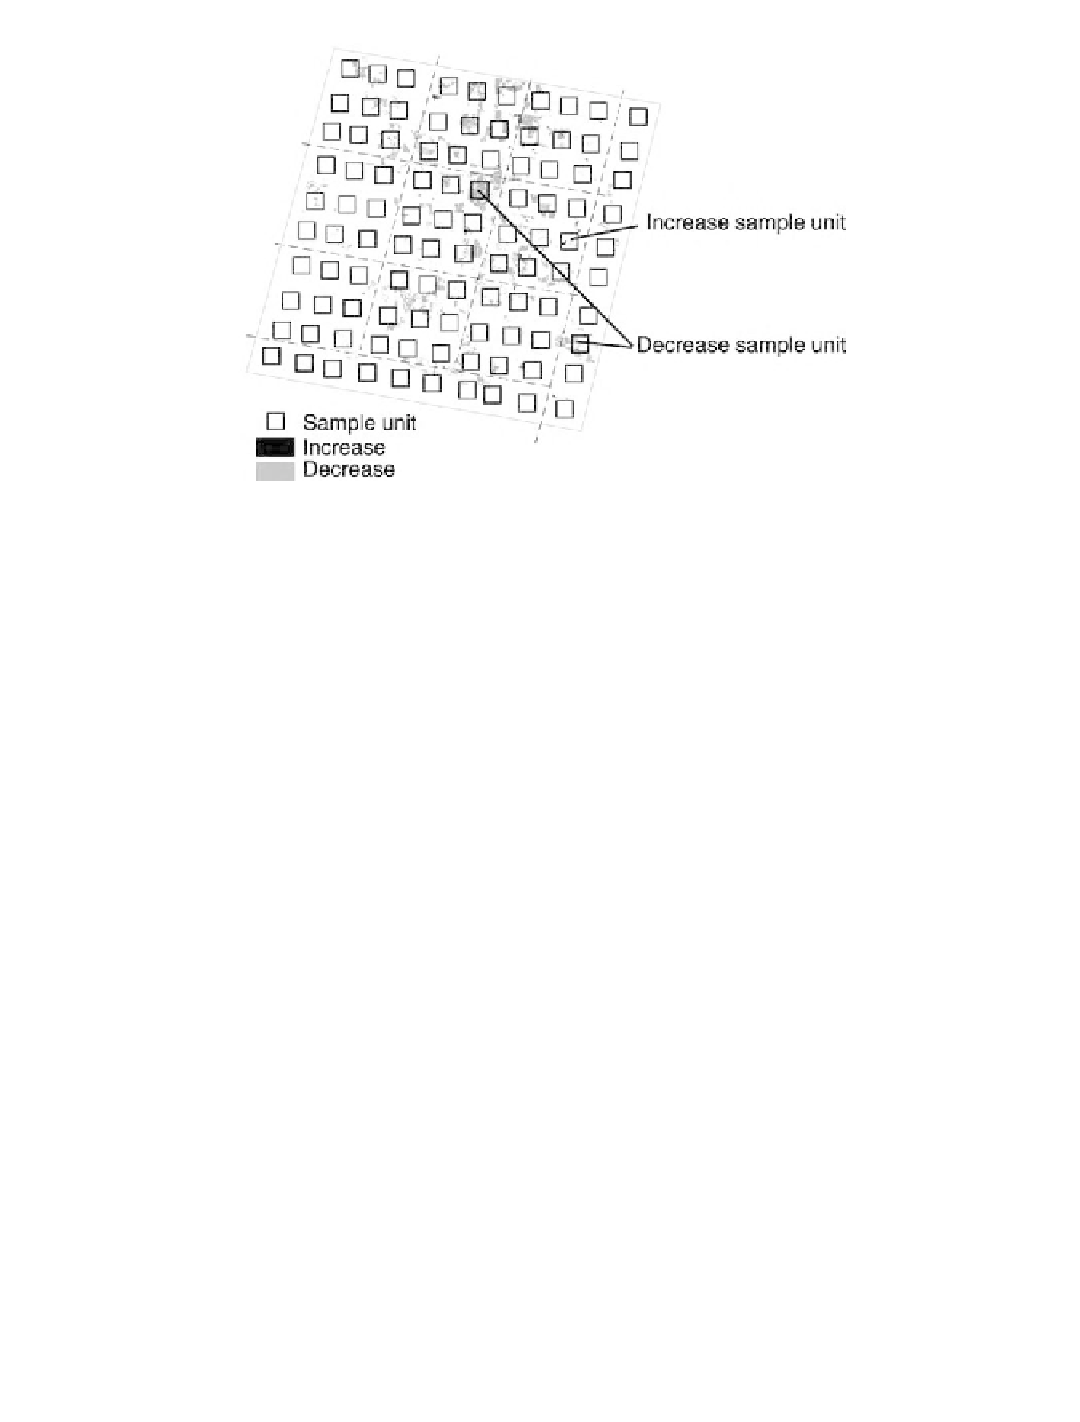
Sampling strategy for estimating land-cover change (increase plus decrease in woody vegetation)
for a TM (Thematic Mapper) image.
Figure 8.4
8.2 METHODS
Lowell's method produces an area-based, independent estimate of change for which confidence
intervals can be calculated; the estimates of change derived from image analysis are then compared
against these confidence intervals. The method uses 500-
500-pixel sample units (Figure 8.4)
selected for each change image in a two-stage procedure to ensure that a minimum number (
¥
) of
samples containing change are included. First, sample units are selected containing change areas
(increase or decrease), proportional to the amount of change across the image. The remaining
sample units are then selected according to a spatially distributed random sample without replace-
ment. Lowell demonstrated that 33 samples were required to obtain stable confidence intervals for
TM scenes in which change was relatively rare (i.e., approximately 0.13% of the scene). The
n
n
could be reduced to 22 for scenes where change was more common (i.e., approximately 2.5%)
(Lowell, 1998). Following sample unit selection, the area of change (increase or decrease in woody
vegetation) was estimated for each sample using image enhancement techniques such as unsuper-
vised classification or by displaying band differences or differences among various combinations
of bands. Confidence intervals for woody vegetation changes were then calculated for the indepen-
dent estimates of change made for each scene. These were then compared with the amount of
change reported for the scene by the corresponding state agency.
Lowell's method was applied to the ALCC results within a spatial hierarchy to enable analysis
of variations in LC change at multiple resolutions (i.e., study area, state, TM scene, and sample
unit). Approximate
-score values were calculated using the state estimates of change, the overall
sample estimate, and the individual sample results. Significance levels for the
z
-scores were cal-
culated and compared for both the overall and individual sample unit results. Approximate confi-
dence intervals (95%) for the estimated proportion of change were also compared to the overall
state estimate. Dual assessment criteria (Jupp, 1998) were implemented to consider both the overall
scene results and the individual sample results; the state change estimates for a scene were only
accepted as reliable when both the overall and individual sample
z
-scores were not significantly
different. Preparation of the grid for sample units was automated by writing a program to determine
the areal extent of each change image and to establish a grid of nonoverlapping 500-
z
¥
500-pixel
sample units.