Geoscience Reference
In-Depth Information
North
Carolina
Tennessee
Mississippi
South
Carolina
Georgia
Alabama
Florida
N
0 0140
210 280 Miles
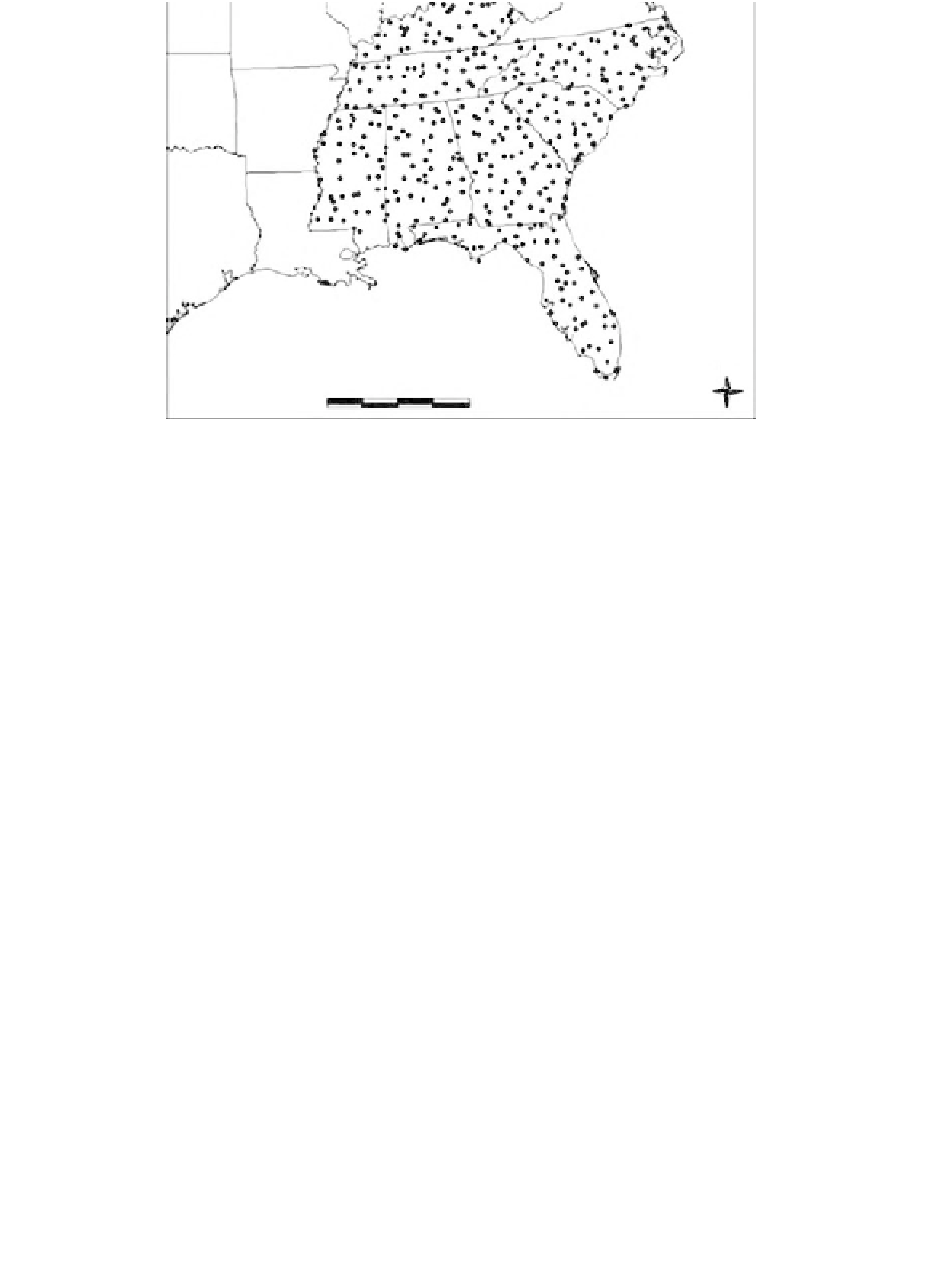
Figure 7.1
Randomly selected photograph center points.
was mapped independently. EPA funded the Center for Earth Observation (CEO) at North Carolina
State University (NCSU) to assess the accuracy of the NLCD for federal geographic Region IV.
An accuracy assessment is an integral component of any remote sensing-based mapping project.
Thematic accuracy assessment consists of measuring the general and categorical qualities of the
data (Khorram et al., 1999). An independent accuracy assessment was implemented for each federal
geographic region after LC mapping was completed. The objective for this study was specifically
to estimate the overall accuracy and category-specific accuracy of the LC mapping effort. Federal
geographic Region IV included the states of Kentucky, Tennessee, Mississippi, Alabama, Georgia,
Florida, North Carolina, and South Carolina (Figure 7.1).
7.2 APPROACH
7.2.1
Sampling Design
Quantitative accuracy assessment of regional scale LC maps, produced from remotely sensed
data, involves comparing thematic maps with reference data (Congalton, 1991). Since there were
no suitable existing reference data that could be used for all federal regions, a practical and
statistically sound sampling plan was designed by Zhu et al. (2000) to characterize the accuracy
of common and rare classes for the map product using National Aerial Photography Program
(NAPP) photographs as the reference data.
The sampling design was developed based on the following criteria: (1) ensure the objectivity
of sample selection and validity of statistical inferences drawn from the sample data, (2) distribute
sample sites spatially across the region to ensure adequate coverage of the entire region, (3) reduce
the variance for estimated accuracy parameters, (4) provide a low-cost approach in terms of budget
and time, and (5) be easy to implement and analyze (Zhu et al., 2000).
The sampling was a two-stage design. The first stage, the primary sampling unit (PSU), was
the size of a NAPP aerial photograph. One PSU (photo) was randomly selected from a cluster of
128 photographs. These clusters were formed using a geographic frame of 30
30 m. Randomly
selected PSU locations are shown in Figure 7.1. The second stage was a stratified random sample,
¥