Graphics Reference
In-Depth Information
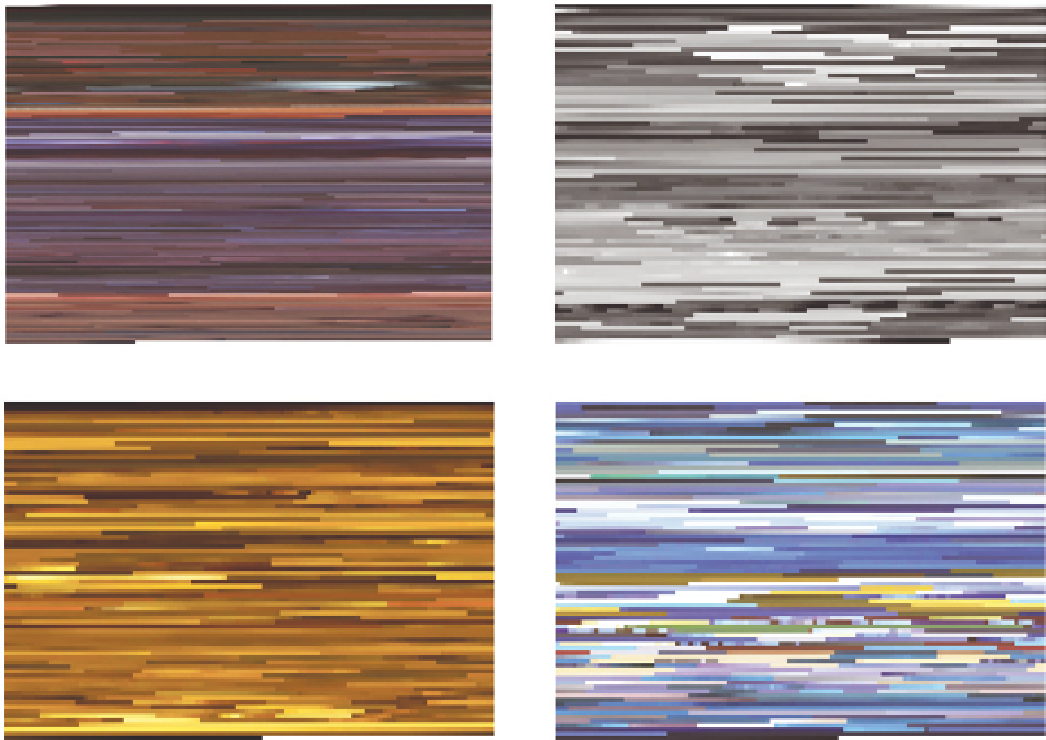
FIGURE 2-25
Thriller, Vogue, Smells Like Teen Spirit, and Express Yourself from
MTV's 10 Greatest Music Videos of All Time
(2001) by Jason Salavon,
A History of the Sky
, shown in Figure 2-27, by artist Ken Murphy also reconfig-
ured our traditional view of time and space; however, instead of movies, the
sky was used as the source of inspiration.
Murphy installed a camera on the San Francisco Exploratorium's roof and
programmed the camera to take a picture every 10 seconds for a year. Instead
of stringing all the pictures together on a single continuous timeline, Murphy
played all the days at once on a 24-hour timeline. In a few minutes, you can
see how the length of days change and how the weather fluctuates for a year.
What if the data source is invisible? How are you supposed to visualize it? As
shown in Figure 2-28, Timo Arnall, Jørn Knutsen, and Einar Sneve Martinussen
fashioned a measuring rod with Wi-Fi sensors and small lights to visualize the
networks that we use every day in
Immaterials: Light painting WiFi
. In any given
Search WWH ::

Custom Search