Graphics Reference
In-Depth Information
Note:
Check out the article “Making Sense
of Graphs” in the
Journal for Research in
Mathematics Education
by Susan Friel, Frances
Curcio, and George Bright for a good summary
of how students comprehend graphs.
Statistics education research shows that when grade school
students first read graphs, they tend to focus on individual
values. That is, they might comprehend that the height of a
bar in a bar chart corresponds to a value, but they don't make
an immediate connection between all the bars. Comparison
comes later and then aggregation. Distributions and multi-
variate relationships are advanced concepts.
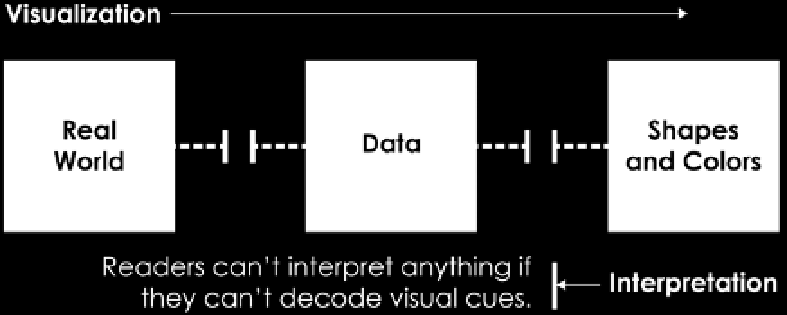
FIGURE 6-18
Broken connections
between visual cues, data, and
what it represents
Note:
See the Annotation section in
Chapter 5, “Designing for an Audience,” for
examples of describing statistical concepts.
You can see how this corresponds to data literacy. It's rela-
tively easy to understand minimums, maximums, and anec-
dotes, but it is trickier as you try to make comparisons within
a population and form clusters. Finally, you must understand
distributions before you can properly interpret variability.
Although findings are in the context of education, visualization for an audience
is essentially teaching. This doesn't mean you should avoid more advanced
visualization methods completely, but when you do use them, explain how
to read them and what they show. There will be fewer misunderstandings.
DATA NAR R ATIV E
Visualization is often framed as a medium for storytelling. The numbers are
the source material, and the graphs are how you describe the source. When
referring to stories or data narrative, I don't mean novels (but great if that's
what you're after). Rather, I mean statistical stories, as shown in Figure 6-19.
It often helps to ask a question about the data and then try to answer that
through the visualization. It gives you a place to start with the data and pro-
vides focus in a graphic. Also, a simple question often leads to other questions
and insights that you might not have thought of.
FIGURE 6-19
(following page)
Statistical questions and possible
outcomes
Search WWH ::

Custom Search