Graphics Reference
In-Depth Information
“There are no hard rules, but, as in any skill-based profession, there
are some things that work better than others, and as for any cultural
activity, you are not acting in the void, but in an established set of
conventions, expectations and common knowledge.”
—Moritz Stefaner
This isn't to say that these rules are wrong. You just have to know when they
apply and keep in mind that most visualization rules are generalizations.
Don't follow them blindly, or you might as well get a computer to do all the
work for you.
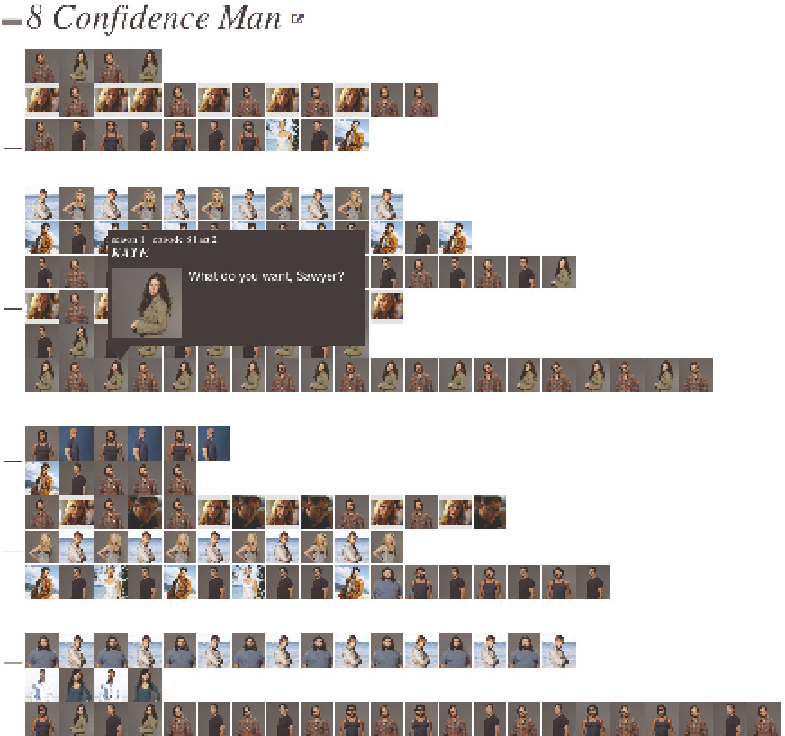
One frequently voiced rule is to show only what is useful and to strip out the
rest, which often leads people to believe that you should always make stripped
down, almost barebones charts. However, what is considered useful? That
depends on your goals. For example, Santiago Ortiz visualized six seasons of
the show
Lost
, as shown in Figure 6-13.
FIGURE 6-13
Lostalgic
(2012)
by Santiago Ortiz,
http://moebio
.com/lostalgic
Search WWH ::

Custom Search