Graphics Reference
In-Depth Information
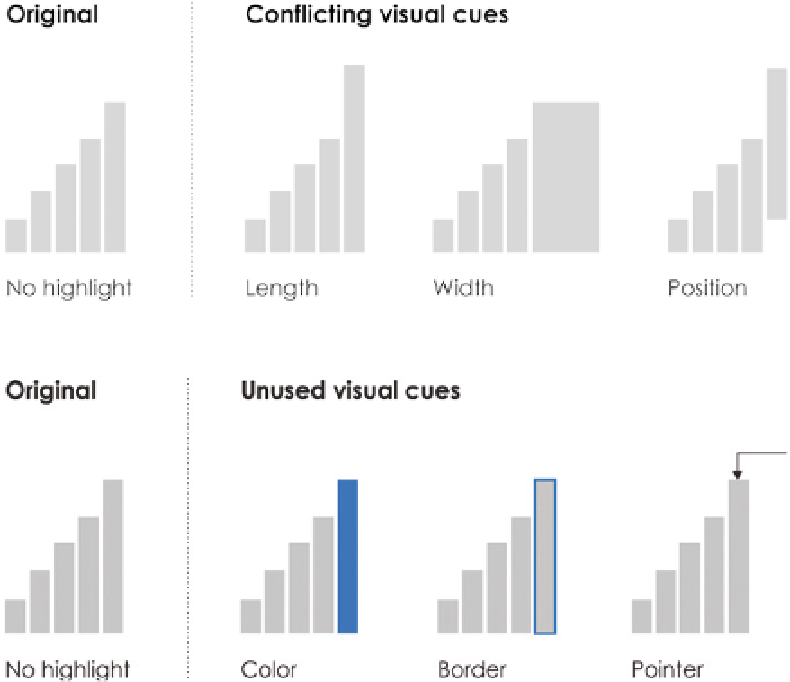
FIGURE 5-30
Using conflicting
visual cues to highlight
FIGURE 5-31
Using unused
visual cues to highlight
ANNOTATION
When you highlight elements, it is not always obvious why, especially when
readers aren't familiar with the data. (And they aren't most of the time.)
Annotation within a visualization can help clearly explain what a visualiza-
tion shows. What is that outlier? What does that trend mean? This might be
left to text outside of a visualization, but when you put explanations within
a graphic—as an additional layer of information—the visualization is self-
encapsulated so that it's useful on its own.
EXPLAIN THE DATA
Like everything discussed so far, annotation follows a visual hierarchy. You
have headers, subheaders, subsubheaders, and explanatory text. As shown
Search WWH ::

Custom Search