Graphics Reference
In-Depth Information
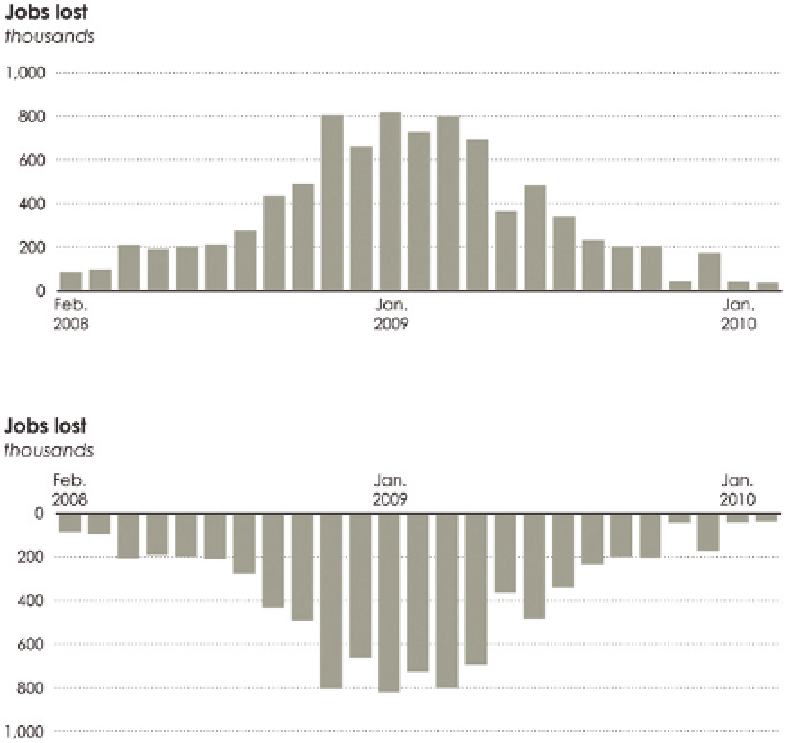
FIGUR E 5-16
Visualizing data
generically
F I G U R E 5 -17
Visualizing data
in context
NEGATIVE SPACE
Clutter is the enemy of readability. A lot of objects and words packed into a
small area can make a visualization confusing and unclear, but put some space
in between and it's often a lot easier to read. You can use space to separate
clusters within a single visualization, or you can use space to divide multiple
charts, so that they are modular and don't all run together. This makes a visu-
alization easier to scan and mentally process piece-wise.
Figure 5-18 shows equally spaced rectangles, which appear to be in the same
cluster, followed by ways to separate them with space and other elements,
such as lines and contrasting colors. The space implies division (which you
should keep in mind when you don't want to separate visual elements).
Search WWH ::

Custom Search