Graphics Reference
In-Depth Information
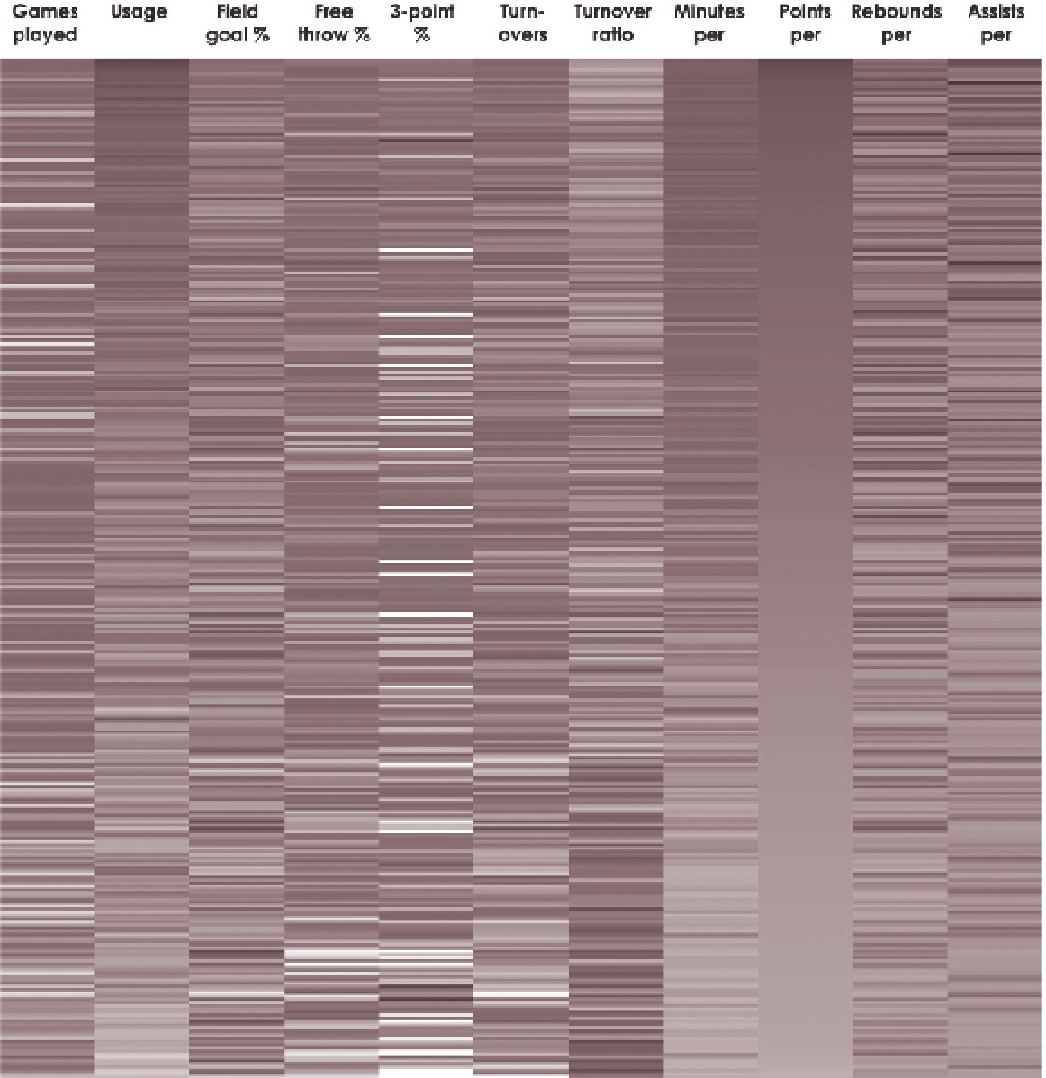
FIGURE 4-43
Relationships with heat map
For example, to plot a player, you start on the left, look up how many games
he played, and start a line in the corresponding spot on the first vertical axis.
Draw the line to the spot on the next axis that corresponds to the player's
usage percentage. Do that for all the variables and all the players, and that's
the parallel coordinates plot.
Search WWH ::

Custom Search