Graphics Reference
In-Depth Information
sorting of values. After that, look at the distribution of the parts. Are most values
high? Low? Somewhere in between? Finally, look for structure and patterns. If a
couple of categories have the same value or high differing ones, it's worth asking
why and what makes the categories similar or different, respectively.
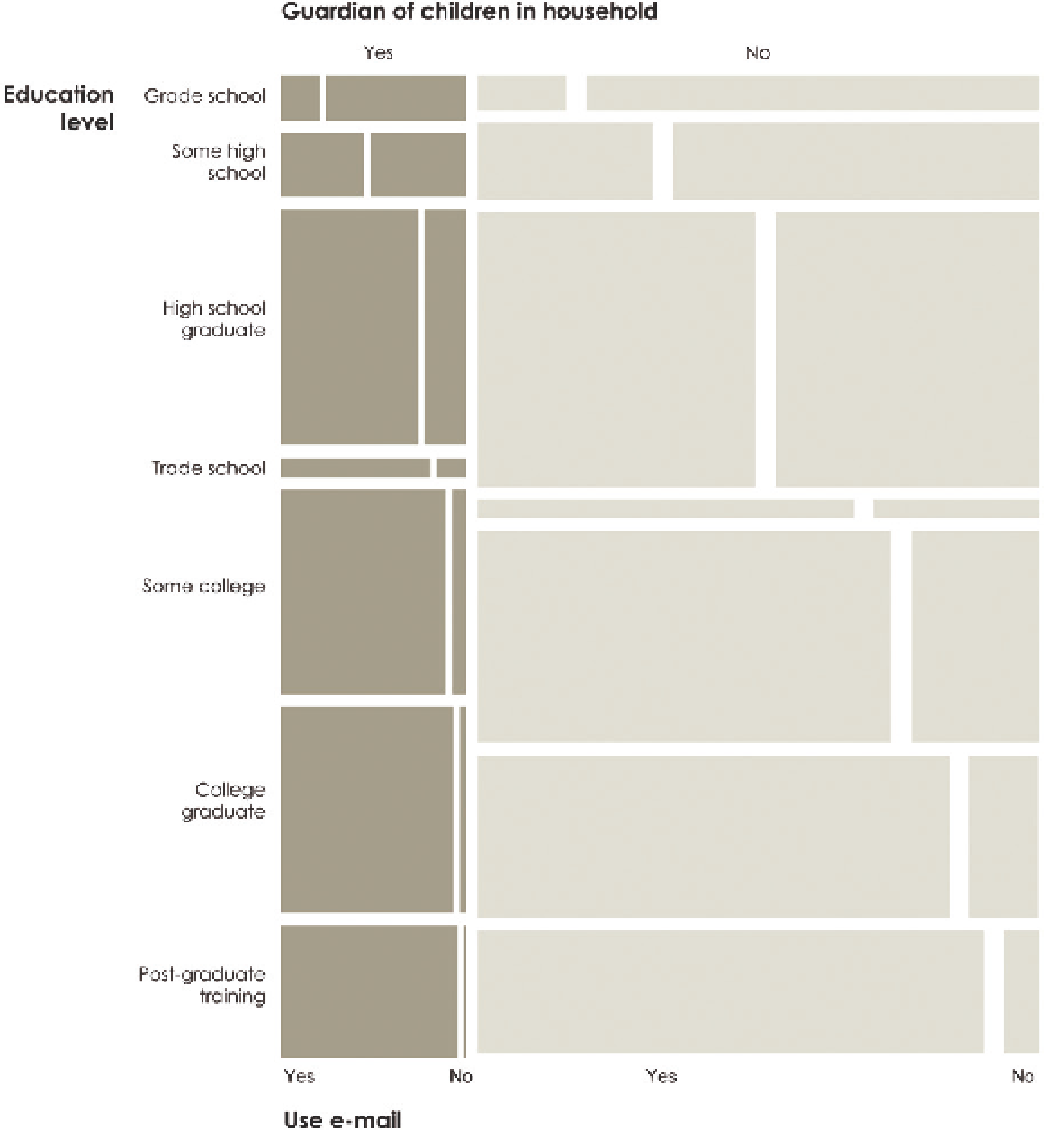
FIGURE 4-14
Mosaic plot with three variables
Search WWH ::

Custom Search