Graphics Reference
In-Depth Information
u
What visualization methods should you use?
u
What do you see and does it makes sense?
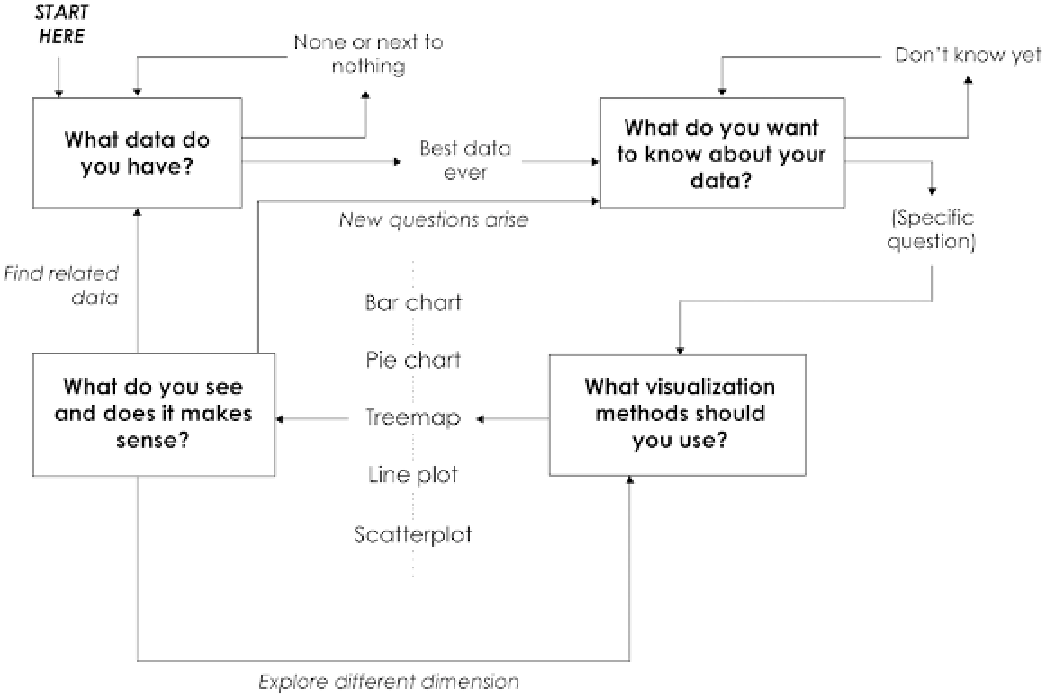
The answer to each question depends on the answers that come before,
and it's common to jump back and forth between questions. As shown in
Figure 4-1, it's an iterative process. For example, if your dataset is only a handful
of observations, this limits what you can find in your data and what visualiza-
tion methods are useful, and you won't see much.
FIGURE 4-1
The iterative data exploration process
On the other hand, if you have a lot of data, what you see when you visualize
one aspect of it can lead to a curiosity about other dimensions, which in turn
leads to different graphics. This is the fun part.
WHAT DATA DO YOU HAVE?
People often form a picture in their head of what a visualization should look
like or find an example that they want to mimic. The excitement is great, but
Search WWH ::

Custom Search