Graphics Reference
In-Depth Information
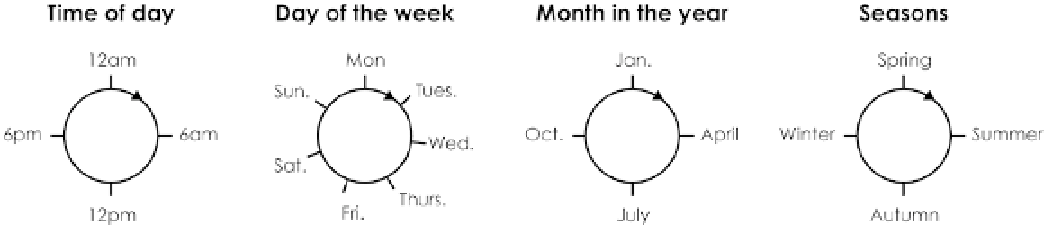
Time
Time is a continuous variable, which lets you plot temporal data on a linear
scale, but you can divide it into categories such as months or days of the week,
which lets you visualize it as a discrete variable. Also, it cycles, as shown in
Figure 3-19. There's always another noon time, Saturday, and January.
FIGUR E 3-19
Time cycles
You saw this in Chapter 1, which showed fatal crashes over time, by year, by
month, by day, and by hour. Data was plotted continuously in these cases.
However, aggregates by time of day, day of the week, and month (over mul-
tiple years) showed a different picture.
When communicating data to an audience, the time scale, like geographic
maps, gives you an advantage of lending a reader connection because time
is a part of everyday life. You feel and experience time internally and through
your clocks and calendars, and as the sun rises and sets.
CONTEXT
Context (information that lends to better understanding the who, what, when,
where, and why of your data) can make the data clearer for readers and point
them in the right direction. At the least, it can remind you what a graph is
about when you come back to it a few months later.
Sometimes context is explicitly drawn, and other times it's implied through
the medium. For example, as shown in Figure 3-20, designers Matt Robinson
Search WWH ::

Custom Search