Graphics Reference
In-Depth Information
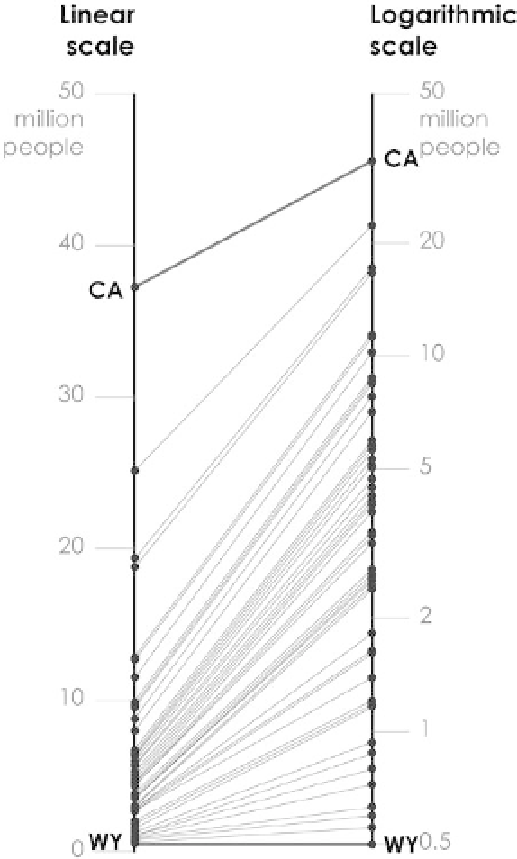
in Figure 3-16, with a linear scale, states with smaller populations are clustered
on the bottom, and then a few states rest on top. It's easier to see points on
the bottom with a logarithmic scale.
FIGUR E 3-16
Linear versus
logarithmic scale
A percent scale is usually linear, but when it's used to represent parts of a
whole, its maximum is 100 percent. As shown in Figure 3-17, the sum of all the
parts is 100 percent. This seems obvious—that the sum of percentages in a
pie chart, represented with wedges, should not exceed 100 percent—but the
Search WWH ::

Custom Search