Graphics Reference
In-Depth Information
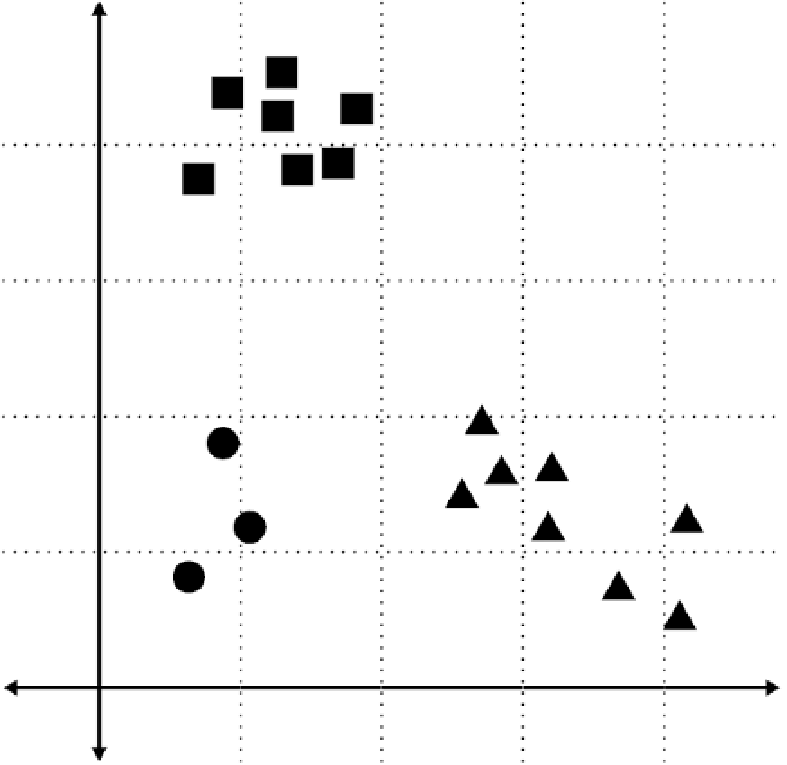
FIGURE 3-9
Different shapes in
scatterplot
Say you use squares, shapes with two dimensions—width and height—to
represent your data. The greater a value, the greater the area of a square, so if
one value is 50 percent greater than another, you want the area of the square
to be 50 percent greater than the other. However, if you increase the sides of
the square by 50 percent instead of the area, which is what some software
does by default, the larger square is too big. Instead of an increase in 50 per-
cent, it's an increase of 125 percent. See the jump in difference in Figure 3-10.
You run into the same problem with three-dimensional objects, but the mistake
is more pronounced. Increase the width, height, and depth of a cube by 50
percent, and the volume of the cube increases by approximately 238 percent.
Search WWH ::

Custom Search