Graphics Reference
In-Depth Information
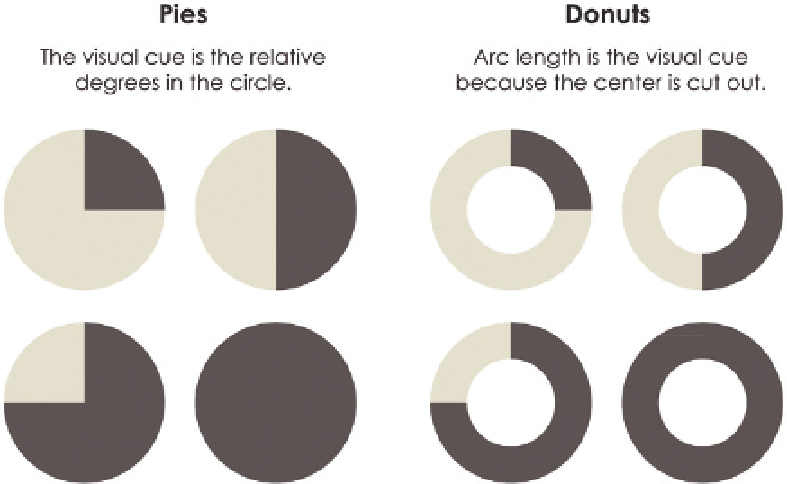
FIGURE 3-6
Mmm, pies and
donuts
Note:
Although the donut chart is often con-
sidered the pie chart's close cousin, arc length
is the former's visual cue because the center of
the circle, which indicates angles, is removed.
For each angle in between zero and 360 degrees, there
is an implied opposite angle that completes the rotation,
and together those two angles are considered conjugates.
This is why angles are commonly used to represent parts
of a whole, using the fan favorite, but often maligned, pie
chart shown in Figure 3-6. The sum of the wedges makes
a complete circle.
Direction
Direction is similar to angle, but instead of relying on two vectors joined at a
point, direction relies on a single vector's orientation in a coordinate system.
You can see which way is up, down, left, and right and everything in between.
This helps you determine slope, as shown in Figure 3-7. You can see increases,
decreases, and fluctuations.
The amount of perceived change depends a lot on the scale, as shown in
Figure 3-8. For example, you can make a small change in percentage look like
Search WWH ::

Custom Search