Graphics Programs Reference
In-Depth Information
1
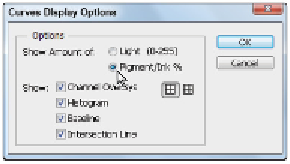
With the Properties panel open, click the panel menu in the upper-right area, and select Curves Display
Options. The Curves Display Options dialog box appears.
2
Choose Show Amount of Pigment/Ink %, then click OK.
Change the Curves panel to display curve as if it was based upon ink.
Whether you work on print or web images, it can be helpful to visually interpret the curves panel based
upon ink, since this puts the lightest colors of the image in the lower left and the darkest part of the im-
age in the upper -right.
Inputting the white and black point values
The process of defining values for the lightest and darkest points in your image is not difficult, but it helps
if you know where the image is going to be used. If you have a good relationship with a printer, they can
tell you what white point (lightest) or black point (darkest) values work best for their presses and material
that you are printing on. Alternatively, you can use the generic values suggested in this topic. The values
shown in this example are good for typical printing setups and for screen display.
1
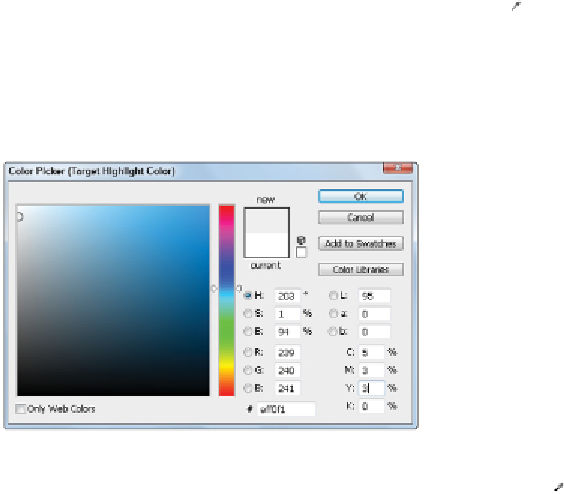
Double-click the Sample in image to set White Point button ( ) found in the Properties panel; the Color
Picker (Target Highlight Color) dialog box appears. Even though you are in RGB, you can set values in
any of the color environments displayed in this window. In this example, you'll use CMYK values.
2
Type
5
in the C (Cyan) text field,
3
in the M (Magenta) text field and
3
in the Y (Yellow) text field.
Leave K (Black) at 0, and click OK. A warning dialog box appears asking if you would like to save the
target values; click Yes.
Setting the target highlight color.
3
Now, double-click the Sample in image to set Black Point button ( ). The Color Picker (Target Shadow
Color) dialog box appears.