Graphics Programs Reference
In-Depth Information
has enough tonal information to produce a quality image. You will reference the Histogram panel
throughout this lesson.
1
If your Histogram panel is not visible, choose Window > Histogram. The Histogram panel appears.
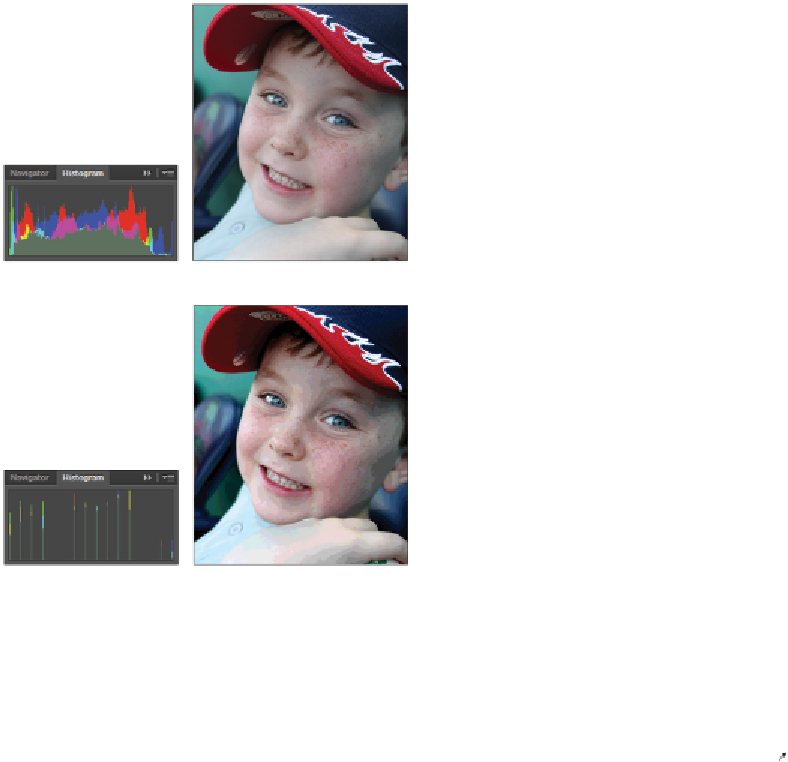
A histogram shows the tonal values that range from the lightest to the darkest in an image. Histograms
can vary in appearance, but typically you want to see a full, rich, mountainous area representing tonal
values. See the figures for examples of a histogram with many values, one with very few values, and
the images relating to each.
A good histogram and its related image.
A poor histogram and its related image.
Keep an eye on your Histogram panel. Simply doing normal corrections to an image can break up a his-
togram, giving you an image that starts to look posterized (when a region of an image with a continu-
ous gradation of tone is replaced with several regions of fewer tones). Avoid breaking up the histogram
by learning to use multi-function tools, such as the Curves panel, and making changes using adjustment
layers that don't change your original image data.
2
To make sure that the values you read in Photoshop are accurate, select the Eyedropper tool ( ). Notice
that the Options bar (across the top of the document window) changes to offer options specific to the
Eyedropper tool. Click and hold the Sample Size drop-down menu and choose 3 by 3 Average. This en-
sures a representative sample of an area, rather than the value of a single screen pixel.