Geography Reference
In-Depth Information
Showing the Ups and Downs: Topography
All points on Earth have an elevation with respect to sea level. Altogether, they constitute “the lay of
the land.” (Keep in mind that elevation also pertains to points on the ocean's bottom.)
Topography
is
the art and science of depicting heights and depths on a map. Like scale, topographic information is
a basic feature of many maps and is commonly represented in three ways as indicated in Figure 5-3.
The following sections discuss the three ways of showing topographic information.
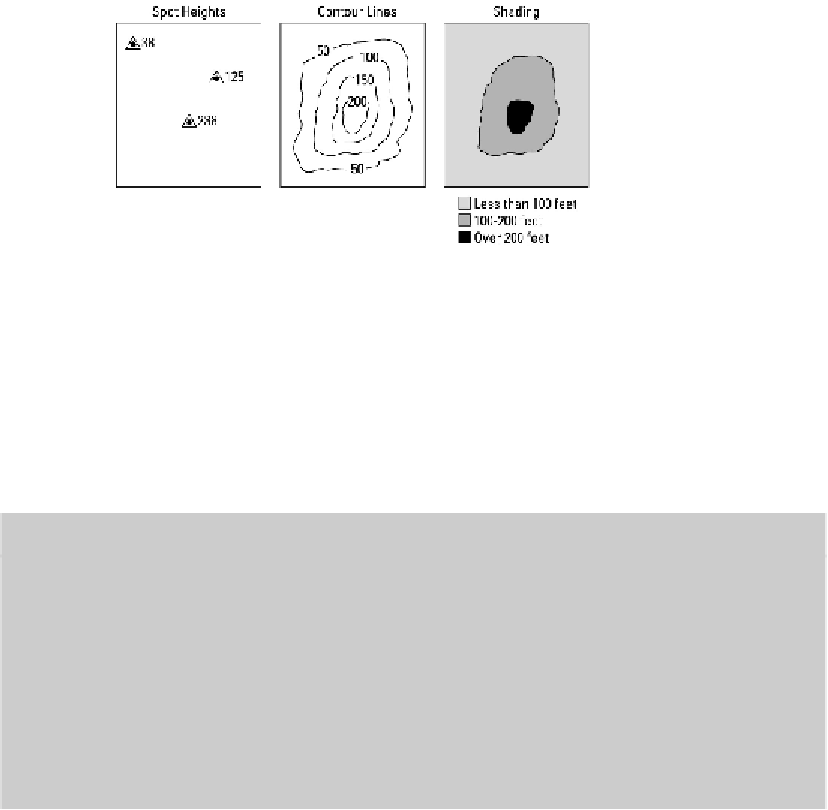
Figure 5-3:
The
terrain of a make-
believe place, as
depicted
three
ways.
Spot heights
A
spot height
is a symbol (typically a tiny dot, plus sign, or triangle) accompanied by a number that
indicates the elevation of a given point in feet or meters (see Figure 5-3a). Sometimes a cartographer
wishes to emphasize something other than topography on a map, yet provide elevation information
for a few selected points in order to convey the lay of the land. Spot heights serve this purpose.
Distortion for a purpose
A
cartogram
is a map in which different areas are distorted in proportion to numerical
data. Following are two maps of Australia. The one on the left shows the true shape of the
continent. The one on the right is a
cartogram
in which the sizes of Australia's states and
territories are distorted in proportion to their populations. As a result, the cartogram looks
much different than the “real thing.” New South Wales, which is home to Sydney (the na-
tion's largest city), contains about 10 percent of the country's territory, but about 34 per-
cent of its population. On the cartogram, therefore, New South Wales appears bloated.
In contrast, Northern Territories accounts for 17 percent of the country's territory but only
0.01 percent of its population. On the cartogram, therefore, Northern Territories is quite
small. These extremes visually highlight Australia's uneven population geography. Usu-