Geoscience Reference
In-Depth Information
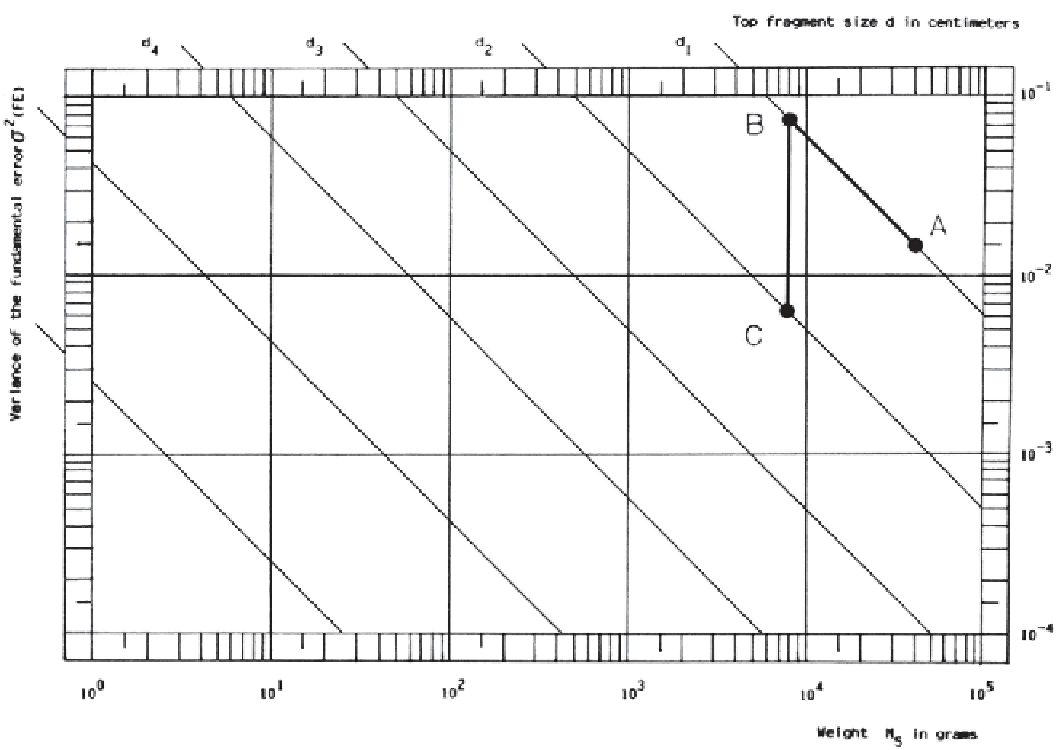
Fig. 5.5
Example nomograph showing the nominal size lines, a sample splitting cycle, and a comminution step. (Hartmann
1992
)
the stages to get a smaller sample are measured and mini-
mized using the constitution heterogeneity of the material
being sampled and the nomograph.
Plotting changes to the sample using this method allows easy
visualization of changes made to the sample. These changes
are actual steps in the sample preparation and can be either
a reduction in fragment size through comminution, crush-
ing or grinding, or a reduction in the sample mass through
splitting.
When the sample is split there is no change in the nominal
fragment size so all of the terms in the sample variance equa-
tion are constant and the variance becomes directly propor-
tional to − log(M
S
). Changes to the mass of the sample, and
the variance of the sample, by splitting will follow a line on
the nomograph with a negative one slope. This allows lines
representing the different nominal fragment sizes during the
sample preparation to be plotted on the nomograph. During
comminution the mass of the sample stays constant and the
other terms of the equation will change. Comminution re-
sults in a reduction of the sample variance due to the reduced
fragment size, and on the nomograph this will be a vertical
line from the larger nominal fragment size line straight down
vertically to the lower nominal fragment size line.
Figure
5.5
shows the size lines for six different nomi-
nal fragment sizes, a sample mass reduction step, and a
5.3.3
Nomograph Construction
A nomograph is a base 10 log-log plot with the sample vari-
ance on the ordinate axis and the sample mass on the abscis-
sa axis. To plot the variances versus sample size the formula
must be converted to logarithmic space:
†
1
‡
2
FE
s
=
ˆ
IH
‰
L
Š
M
1
‹
S
=
c fgd
3
M
S
†
‡
1
2
3
log(
s
)
=
log
c fgd
ˆ
‰
FE
M
log(c fg)
Š
‹
S
=
+
3log(d)
−
log(M )
S
=+ −
C
3log(d)
log(M )
S