Geoscience Reference
In-Depth Information
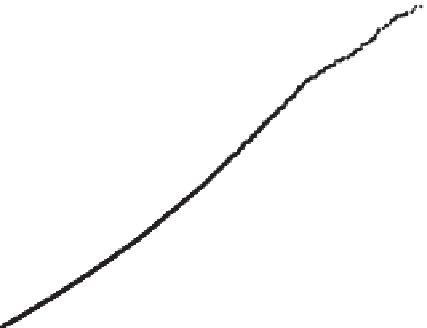
TCu, PF vs AN, QSA
TCu, PF vs AN, K+B
10.0
10.0
8.0
8.0
6.0
6.0
4.0
4.0
2.0
2.0
0.0
0.0
0.
0
2.0
4.0
6.0
8.0
10.0
0.0
2.0
4.0
6.0
8.0
10.0
TCu PF, K+B
TCu PF, QSA
Fig. 4.8
Q-Q plot of TCu (%), Porphyry vs. Andesite, Potassic + Bio-
tite alteration
Fig. 4.6
Q-Q plot of TCu (%), Porphyry vs. Andesite, QSA alteration
porphyry. Figure
4.8
shows the Q-Q plot of both lithologies
for alteration K + B; note how the distributions are quite dif-
ferent. The number of assays available in primary mineral-
ization with potassic and biotite alterations is relatively small
since drilling targets the supergene enriched mineralization.
This is why they were grouped. Primary mineralization is
not as important economically as the upper part of the de-
posit, so it appears reasonable, mostly for pragmatic reasons,
to group the primary mineralization units.
Structural domains 1 and 4 present a clear difference
in terms of TCu grades, compared to structural domains 2
and 3. Domain 3, in particular, is the most different. This is
evident both from descriptive statistics and TCu correlogram
models for the different domains.
Figures
4.9
,
4.10
,
4.11
, and
4.12
show the Q-Q plots of
HE versus LE mineralization (Cc + Py vs. Cc + Cpy + Py) for
Domains 1 through 4, respectively.
Figure
4.9
(structural domain 1) shows that the global
Cc + Py distribution has significantly more grade for the
1-4 % TCu range. The quantile values for higher grades tend
to be similar, which implies that both distributions have a
significant high grade tail.
Figure
4.10
(structural domain 2) shows that the low en-
richment material (Cc + Cpy + Py) has a higher-grade distri-
bution. This is an indication that there is less chalcopyrite in
structural Domain 2, probably due to a deepening of the en-
richment process in a down-thrown structural block. There-
fore, it would be reasonable to combine HE and LE into a
single group. Structural domain 2 is the smallest in volume
of the four domains considered.
The grade distributions in structural Domain 3 (Fig.
4.11
)
behave as expected, with the HE distribution consistently
showing higher grade, while the grade distributions for
structural domain 4 (Fig.
4.12
) are very similar, again prob-
TCu, PF vs AN, SCC
10.0
8.0
6.0
4.0
2.0
0.0
0.0
2.0
4.0
6.0
8.0
10.0
TCu PF, SCC
Fig. 4.7
Q-Q plot of TCu (%), Porphyry vs. Andesite, SCC alteration
Figures
4.6
and
4.7
show the Q-Q plots of all Escondida
Porphyry vs. andesite lithologies, conditioned to the two
main alterations, QSA and SCC, respectively. Note how the
plots are close to the 45° line, which implies similar sta-
tistical distributions. Therefore, TCu grades do not change
much in andesite or Escondida porphyries, as long as the
alteration remains the same. Lesser grades can be expected
if the alteration is SCC, regardless of whether lithology is
andesite or Porphyry. Approximately 18 % of the total assay
intervals are andesite with QSA alteration, while there are
approximately 4 % of Escondida porphyry assays with SCC
alteration.
This is not the case for primary mineralization where there
are significant differences in the statistical characteristics of
TCu grades when comparing andesites with the Escondida