Geoscience Reference
In-Depth Information
CuT, Min=6, All Domains
Q-Q, TCu, Cc+Py vs Cc+Cv+Py, Assays
Number of Data 32787
number trimmed 152326
mean 1.7360
std. dev. 1.5346
coef. of var 0.8840
maximum 44.7000
upper quartile 2.4700
median 1.4000
lower quartile 0.6100
minimum 0.0020
10.0
0.160
8.0
0.120
6.0
0.080
4.0
0.040
2.0
0.000
0.0
0.0
2.0
4.0
6.0
8.0
0.0
2.0
4.0
6.0
8.0
10.0
CUT
TCu Cc+Cv+Py
Fig. 4.2
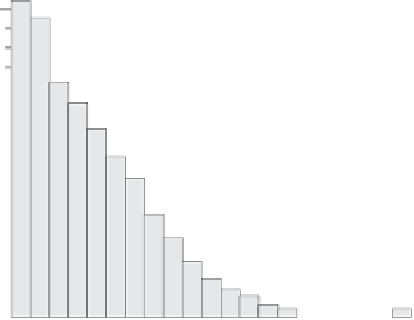
Histogram and basic statistics of TCu (%), Cc + Py unit
Fig. 4.4
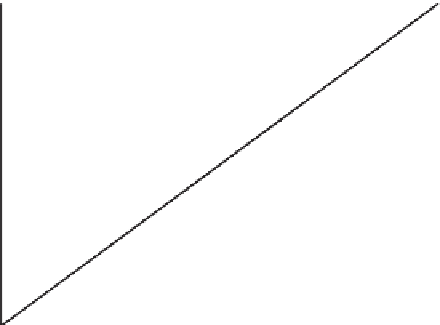
Quantile-Quantile plot of TCu (%), Cc + Py vs. Cc + Cv + Py
mineralization
TCu, Assays, Min=Cc+Py
99.99
Q-Q, TCu, Cv+Py vs. Cc+Cpy+Py, Assays
10.0
99.9
99.8
9
99
8.0
95
90
80
70
4
5
60
6.0
30
20
4.0
10
5
2
1
2.0
0.2
0.1
0.01
0.050
0.50
5.0
50.
0.0
TCu
2.0
4.0
10.0
0.0
6.0
8.0
TCu Cc+Cpy+Py
Fig. 4.3
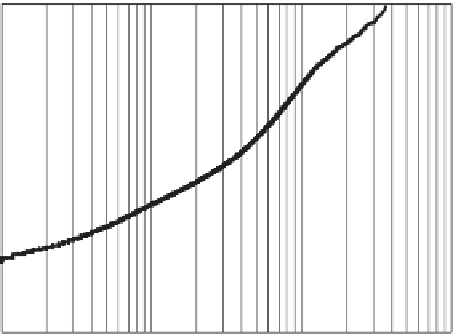
Probability plot of TCu (%), Cc + Py unit
Fig. 4.5
Quantile-Quantile plot of TCu (%), Cc + Cpy + Py and Cv + Py
mineralization
grams were used to provide a global description of the vari-
able, along with summary statistics. Figure
4.2
shows the
histogram and summary statistics for TCu, all assays logged
as chalcocite plus pyrite (Cc + Py, HE1 in Table
4.1
). The
histogram shows a positively-skewed distribution with an
average grade of 1.74 % TCu and a coefficient of variation
of 0.88, which is considered low for assay data.
The cumulative frequency plot is often used to describe
important characteristics of the distribution, such as look-
ing for breaks along an expected continuous line. Figure
4.3
shows the probability plot corresponding to the data in
Fig.
4.2
(TCu, Cc + Py). Note how the curve has inflec-
tion points, one at approximately 2 % TCu, and the other at
about 6 % TCu, suggesting a mixture of populations in the
domain.
Two distributions can be compared using quantile-
quantile (Q-Q) plots. Figure
4.4
shows a Q-Q plot compar-
ing Cc + Py and Cc + Cv + Py mineralization, while Fig.
4.5
shows the comparison for Cc + Cpy + Py and Cv + Py. These
and other similar figures illustrate the similarity of the grade
distributions based on mineralization types alone.
4.3.2
Initial Definition of Estimation Domains
The definition of preliminary estimation domains was done
by analyzing all geologically feasible combinations of the
four variables: mineralization, lithology, alteration, and
structural domains.