Geoscience Reference
In-Depth Information
3.2.2
Geostatistical Geologic Modeling
A geologic model can also be obtained by using a polygonal
(or nearest-neighbor) method, or a geostatistical algorithm.
These techniques can sometimes be used if the data is too
sparse to confidently draw the interpreted shapes and extend
them between sections. One of two basic approaches could
be used: (a) a deterministic model that estimates the geologi-
cal category at each location, or (b) a model that provides a
probability of each category at each location.
The polygonal (or nearest-neighbor) technique assigns the
geologic attribute to points or blocks in the three-dimension-
al space according to a fixed rule; for example, each block is
assigned the geologic attribute from the drill hole data that
is closest to its centroid (Stone and Dunn
1996
). It is simi-
lar to a geologist drawing the interpreted shapes, except that
the computer will not use additional geologic knowledge or
judgement to guide the assignment of geology in the three-
dimensional space. Often, nearest-neighbor models are used
to check the global volumes of interpreted models.
Indicator-based techniques describe the discrete distribu-
tion by assigning an indicator to each geologic attribute. The
indicators can be kriged simultaneously (Multiple Indicator
Kriging) or sequentially one at a time. In either case indica-
tor kriging provides a probability of the geologic variable
being present. An example of the use of indicator kriging
to sequentially estimate mineralogical zones is presented in
Sect. 14.3. The preferred MIK technique has been used with
success at multiple sites as well.
More advanced geostatistical techniques include con-
ditional simulation which provide a probabilistic model of
the geologic variables. There are three common techniques:
(1) sequential indicator simulation, (2) truncated Gaussian
simulation, and (3) object-based modeling. These are dis-
cussed in Chap. 10.
The basic idea of indicator-based techniques is to calcu-
late the probability of each geologic code at an un-sampled
location using all nearby data (Journel
1983
). A specific real-
ization is drawn by Monte Carlo simulation and added to the
set of conditioning data. All un-sampled locations are visited
sequentially. Multiple realizations of the geologic codes are
calculated by repeating the procedure with a different ran-
dom number seed.
Truncated Gaussian simulation requires the geological
codes to be assigned to a range of the Gaussian distribu-
tion (Delfiner and Chilès 1999). The Gaussian variable is
simulated with a geostatistical procedure such as sequential
Gaussian simulation (SGS, see Sect. 10.3) and then truncat-
ed to get back to geological codes. This approach enforces a
particular ordering in the geological codes.
Object-based modeling stochastically positions objects
of arbitrary shape and size within a matrix geological code
(Deutsch
2002
). This approach is applicable when the geo-
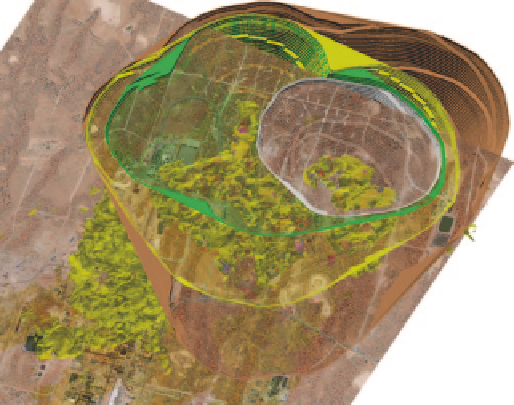
Fig. 3.9
View of Olympic Dam's Au resources with respect to surface
infrastructure and showing four different Mining Phases (pits). Cour-
tesy of BHP Billiton
logical codes are organized in physical shapes that can be
parameterized or digitized. Object-based models have been
used extensively for siliciclastic sedimentary facies models,
for example.
3.3
Visualization
The visualization of geologic and block models is an impor-
tant part of resource modeling. Visualization of three-dimen-
sional bodies and their relative positions and interactions in
space can be used to better understand the proposed geologic
and resource model, oftentimes in relation to a planned open
pit or underground operation.
Visualization provides qualitative evidence of anisotropic
behavior of the attributes as well as an easier grasp of the
scales of variability. Geologic variables and grades distribu-
tions can be visualized in conjunction with some of the tools
described in Sect. 3.3.2. This allows a better understanding
of the continuity of the mineralization.
Figure
3.9
shows the Olympic Dam Au resource model
model in relation to surface infrastructure and Mining Phases
(pits), looking to the North-Northwest. The blocks have been
made into a solids model using a grade indicator. Note that
some of the resources are left out of all the pits shown.
Another example is shown in Fig.
3.10
where a set of
tourmaline veins are shown with topography, the location of
the cross sections used to interpret the geometry of the veins,
and several existing underground workings and accesses.
The view is from underneath. If the visualization is devel-
oped within an interactive three-dimensional environment,
the relation of the underground workings and the interpreted
veins can be used to design future stopes and accesses.