Geoscience Reference
In-Depth Information
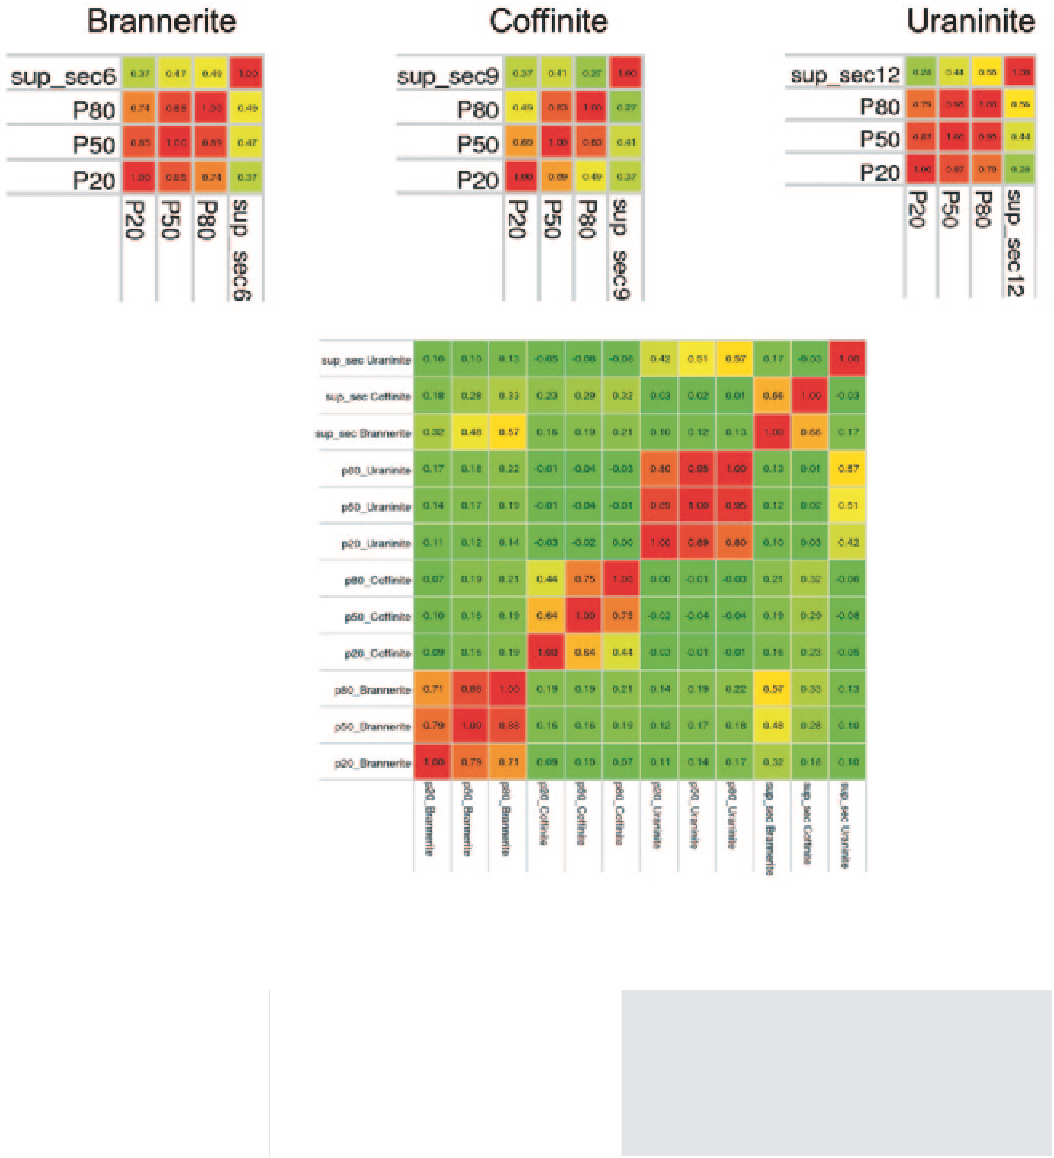
Fig. 14.68
Correlation between the grain size variables. Above: correlations from 497 data to the super secondary variables; below: correlations
from one grain size simulation
Table 14.24
Variograms for the
grain size data. A nugget (C0)
and two spherical structures
(C1 and C2) were used with no
plunge/dip angle and no horizon-
tal anisotropy
5DQJH
5DQJH
9DULDEOH1DPH&&
&
+RUL]RQWDO 9HUWLFDO +RUL]RQWDO 9HUWLFDO
%UDQQHULWH
&RIILQLWH
8UDQLQLWH
The super secondary variable is used as a collocated sec-
ondary variable for each of the grain size models. Note that
for the grain size variables neither a logarithmic nor a PCA
transformation is considered because there are only three
variables (p
20
, p
50
and p
80
) for each mineral. Cosimulation of
three variables can be accomplished in a reasonable amount
of CPU time. This procedure is repeated for brannerite, coffi-
nite and uraninite. This includes building a new super second-
ary variable for each mineral. Figure
14.68
shows the correla-
tions between grain size variables for each uranium mineral.
Very few data exist for the grain size variables and the var-
iograms are unstable, and so the same variograms are used
for the p
20
, p
50
and p
80
of each mineral. The spatial structure
for the p
20
, p
50
and p
80
are similar, with the small differences
likely due to lack of data. Parameters for the variograms used
are shown in Table
14.24
.