Geoscience Reference
In-Depth Information
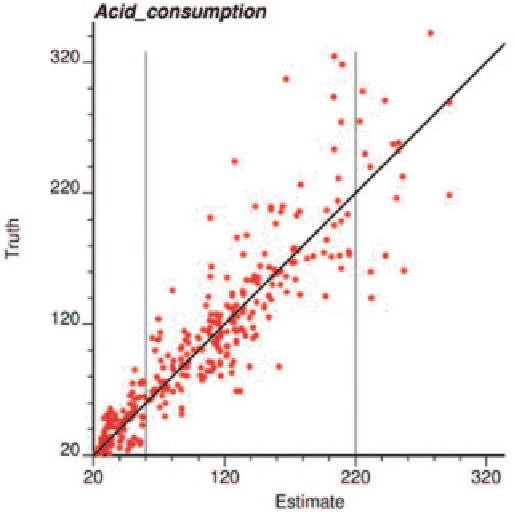
estimate of 220 kg/ton. The measure of uncertainty used is
the spread of the true values around the estimate. In this
case, the p90-p10 range was chosen.
14.7.3
Analysis
All samples were used to generate the regression models
with the above methodology. High correlation between the
estimate and the truth is desirable. Rather than show the 768
coefficients for variable merging and the 24 regression coef-
ficients, a tornado chart (Fig.
14.63
) is used to illustrate the
influence of each of the 112 variables on the overall model.
The lower limit is determined by selecting the p
10
value for
the input variable of interest and setting all remaining 111
variables to their p
50
value. An estimate is made for each of
the six output variables, giving the lower limit on the tornado
chart. Similarly, the p
90
value is selected for the variable of
interest to generate the upper limit on the tornado chart. A
short horizontal line to the left of the variable indicates that
the variable is negatively correlated with the output vari-
able. Bars are shaded based on the origin of the variable:
White—head assays; Gray—associations; Red—mineral-
ogy; Black—specific gravity.
Figure
14.64
shows the models built on all possible data
points available for the different models. Some interesting
relationships were discovered in the cross plots and the tor-
nado charts:
• Na is a significant contributor for DWi/BMWi—indicates
different mineralogy.
• SG is important for DWi but not BMWi—this is expected
as it matters whether the rock is brittle or not, and this
is related to the ratio of iron/silica content in the rock
matrix.
• BMWi is heavily influenced by the head assays (top 6
variables contributing to BMWi are from head assays).
• Individual mineralogy variables have little significance
(Cu recovery is the exception).
• Presence of Chalcopyrite and acid insoluble gangue are
critical to Cu recovery.
• Cu wt% has a large effect on U
3
O
8
recovery but little
effect on Cu recovery. This is because Cu recovery is
approximately constant for the high Cu grades found in
the deposit.
• Based on the tornado charts, associations are important
for DWI, Cu recovery, acid consumption and net recov-
ery. This is also seen in the comparison of the typical and
full models (Fig.
14.64
) as the BMWi and U
3
O
8
recovery
predictions are not significantly altered by removing the
association data.
• Recoveries are the most difficult variables to predict
(lowest correlation on Fig.
14.64
). This is expected, as
recovery is dependent on a large number of complex
interactions.
Fig. 14.62
The uncertainty in an estimate of 60 vs. 220 kg/ton.
There is more uncertainty at 220 kg/ton
The second level groups the variables into the final 4
super-secondary variables used for regression:
A. Retained variables
B. Head assays
C. Mineralogy
D. Associations
Step 4: Regression
The typical and limited models are gen-
erated by regression on variables A, B, and C while the full
model considers variables A-D. Regression is performed
with both linear and quadratic terms. However, through
cross validation it was found that increasing the number of
terms beyond the linear coefficients resulted in little consis-
tent gain and the linear model is sufficient. Thus, the final
model becomes:
Prediction
=+++
av
bv
cv
dv
1
2
3
4
Step 5: Back Transformation
Once the predictions are
made in normal units for each of the six output variables,
they must be transformed back into original units using the
original transformation tables.
Step 6: Determine Uncertainty in the Model
When a
prediction is made, the uncertainty in that prediction is also
determined. The uncertainty is obtained by examining the
distribution of true values for a given estimate. Consider the
difference in making an acid consumption prediction of 60
vs. 220 kg/ton (Fig.
14.62
). There is more uncertainty in the