Geoscience Reference
In-Depth Information
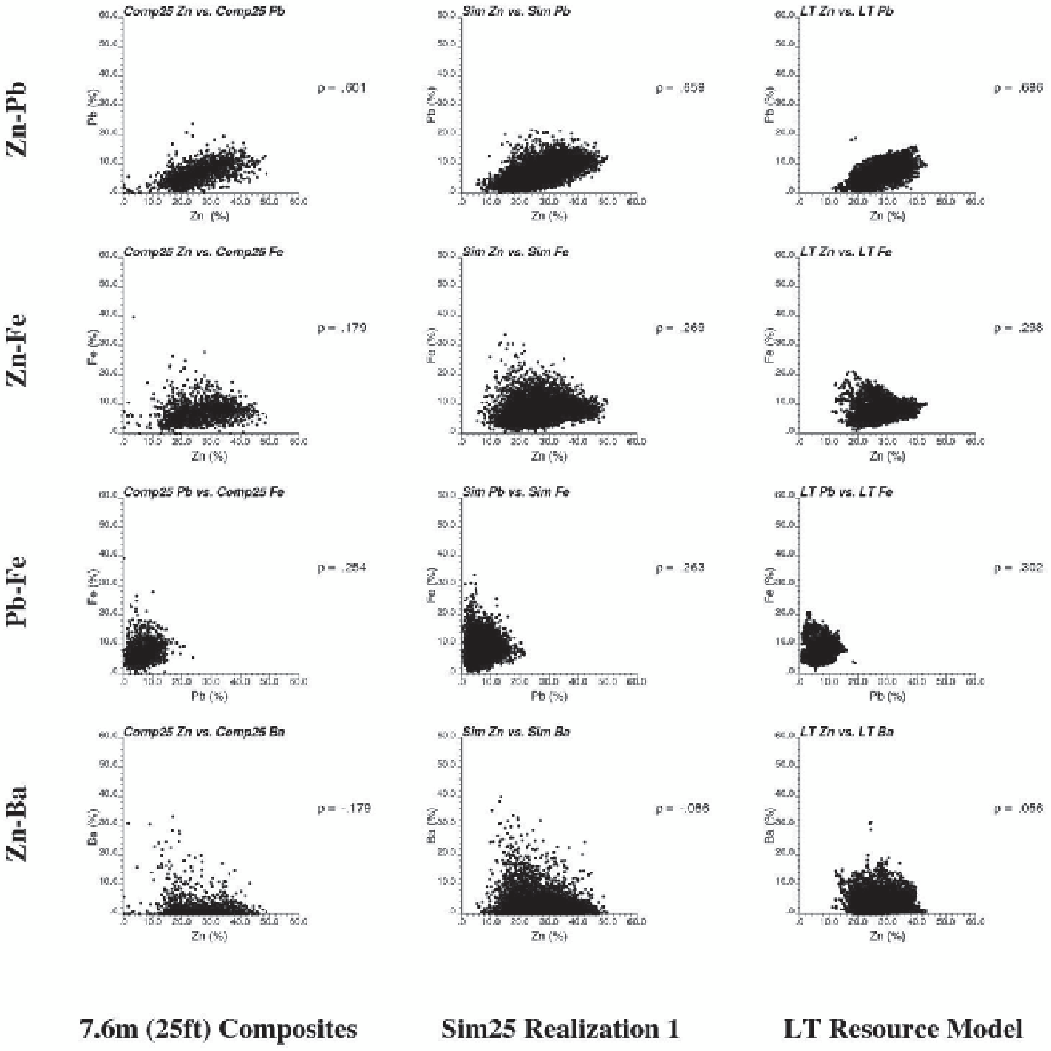
Fig. 14.44
Comparison of multivariate features reproduction for Zn-Pb (top row), Zn-Fe (second row), Pb-Fe (third row), and Zn-Ba (bottom
row). Cross-plots using 25ft composites are shown on the left column; from the upscaled simulations are shown in the middle; and from the avail-
able long term resource model are shown in the right column
14.4.5
Reference Data
of 0 to 1.0), were used to determine a multiplicative factor
for the maximum Zn recovery of 83.6 %; in this way, high
Fe or Ba content would result in reduced Zn recovery. The
price for Zn was chosen to be $ 680/ton of Zn, and the price
for Pb was chosen as $ 380/ton of Pb; both prices were ap-
proximated based on the metal prices from the London Metal
Exchange in 2003. In order to yield approximately 50 % ore
and 50 % waste classification, the cost per ton mined was
chosen arbitrarily.
The density and number of BH data is sufficient to be consid-
ered as a reference data set. Only a small area was modeled,
chosen to be in a marginal zone, where ore/waste classifica-
tion based on the models would have the largest impact.
Figure
14.46
shows the available BH data in the chosen
region of 400 × 400 ft in the Bench 850, and the subset of
data extracted from this region. The available data consists