Geoscience Reference
In-Depth Information
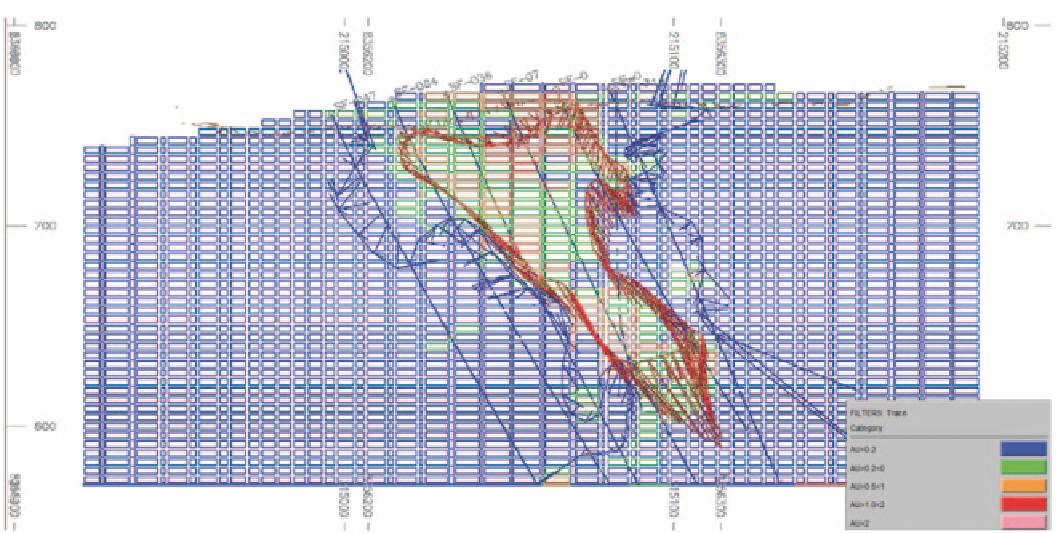
Fig. 14.35
Cross-sectional view of the MIK grade model with 2 m composites used for grade estimation. Warm colors represent higher-grade
mineralization
Several statistical and visual checks were performed
on the resource model. The block model was reviewed on
sections and plans, looking at estimated block grades, the
composite data, and the envelopes used to define the volume
within which the interpolation took place. The intent of the
check is to ensure that every block grade can be explained
as a function of the surrounding composites, the variogram
models used, and the kriging plan applied.
There is significant mineralization at lower elevations,
even below the current pit limit. This is considered a signifi-
cant risk factor because the optimized pit may reach greater
depths based on higher-grade ore with less drill hole infor-
mation. It is necessary to confirm this mineralization with
further drilling.
The smoothing effect of kriging can change significantly
the shape of the optimal pits, providing a falsely optimistic
or pessimistic picture of grade continuity. Proper consider-
ation of high-grade continuity and the volume-variance ef-
fect at São Francisco is extremely important. Figure
14.36
shows that the reblocked MIK model is more diluted com-
pared to the predicted Discrete Gaussian model, tracking the
SMU grade-tonnage curves by cutoff region. The differences
observed are partly due to the resource model including not
only internal dilution, as the predicted SMU distribution
does, but also geologic dilution. Nonetheless, there is a clear
indication of the difficulties of adequately estimating the in-
ternal dilution for this deposit.
Other statistical checks not presented here indicate that the
MIK model behaves as expected, is internally consistent with
the assumptions and data used to build the model, and has no
obvious anomalous values. It is globally unbiased compared
to the declustered composites, and internally consistent with
the data and correlogram models used to create it.
14.3
Modeling Escondida Norte's Oxide Units
with Indicators
1
The Escondida Norte deposit is owned by BHP-Billiton, and
is located 5 miles north of the main Escondida mine and mills.
Geologically, the Escondida Norte deposit is the eastern por-
tion of the Zaldívar deposit, currently mined by Compañía
Minera Zaldívar (100 % owned by Barrick Gold, Fig.
14.37
).
A Porphyry copper deposit such as the Escondida Norte
deposit has, characteristically, an oxide zone above the en-
riched sulfide zones, often separated into high enrichment
and low enrichment blankets. This zonation of mineralogy
zones stems from the position of the water table which con-
trols supergene mineralization events. A description of this
type of deposit and mineralization zones can be found in
Guilbert and Park (1985).
Some mineralization units of the Escondida Norte deposit
are small relative to the drill hole spacing available, and thus
difficult to model using traditional interpretations based on
cross sections and plan views. This is the case for the oxides
and other units above the Top of Sulfides (TOS) surface. The
TOS surface separates the oxidized portion of the deposit,
above where acid-soluble copper grades (SCu) are signifi-
1
BHP-Billiton is gratefully acknowledged for allowing publication of
this case study. Geologists R. Preece (BHP-Billiton) and J.L. Céspedes
(independent consultant) were responsible for large part of the work