Geoscience Reference
In-Depth Information
Table 14.10
Iteration #5, annual comparison, by domains
0RGHO
7&X
0RGHO7RQV
[
0RGHO
0HWDO
5HIHUHQFH
7&X
5HIHUHQFH
7RQV
5HIHUHQFH
0HWDO
*UDGH
'LII
7RQV
'LII
0HWDO
'LII
&XWRII
$QQXDO'RPDLQ
$QQXDO'RPDLQ
$QQXDO'RPDLQ
$QQXDO'RPDLQ
$QQXDO'RPDLQ
$QQXDO'RPDLQ
$QQXDO'RPDLQ
CuT, UG_MAY=1, Modelo 2003
Number of Data 21308
number trimmed 295435
mean 0.7731
std. dev. 0.3489
coef. of var 0.4513
maximum 3.7870
90th quantile 1.1910
upper quartile 0.9300
median 0.7010
lower quartile 0.5290
10th quantile 0.4280
minimum 0.1220
i.e., it is internally consistent, and that (b) the model predicts
reasonably well past production, which is defined by accep-
tance criteria such as the ones described above.
0.160
0.120
The resource model should be internally consistent:
The
estimated block values should behave as expected, with no
anomalous values and consistent with the methodology applied.
0.080
The resource model should be unbiased:
The global
grade averages for each Domain (at a 0.0 % TCu cutoff)
should be similar to the
declustered
means of the cor-
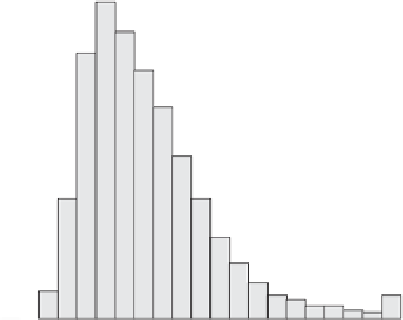
responding 10 m drill hole composites. For example,
Fig.
14.28
shows the histogram of TCu estimated block
values for Domain = 1 (Oxides) of the resource model,
which should be compared to Fig.
14.14
(histogram of
the declustered 10 m Domain 1 composites). The resource
model for Domain 1 is unbiased, with a global mean aver-
0.040
0.00
0
0.00
0.50
1.00
1.50
2.00
CUT
Fig. 14.28
TCu Histogram, Domain = 1, Oxides, Resource Model
2003