Geoscience Reference
In-Depth Information
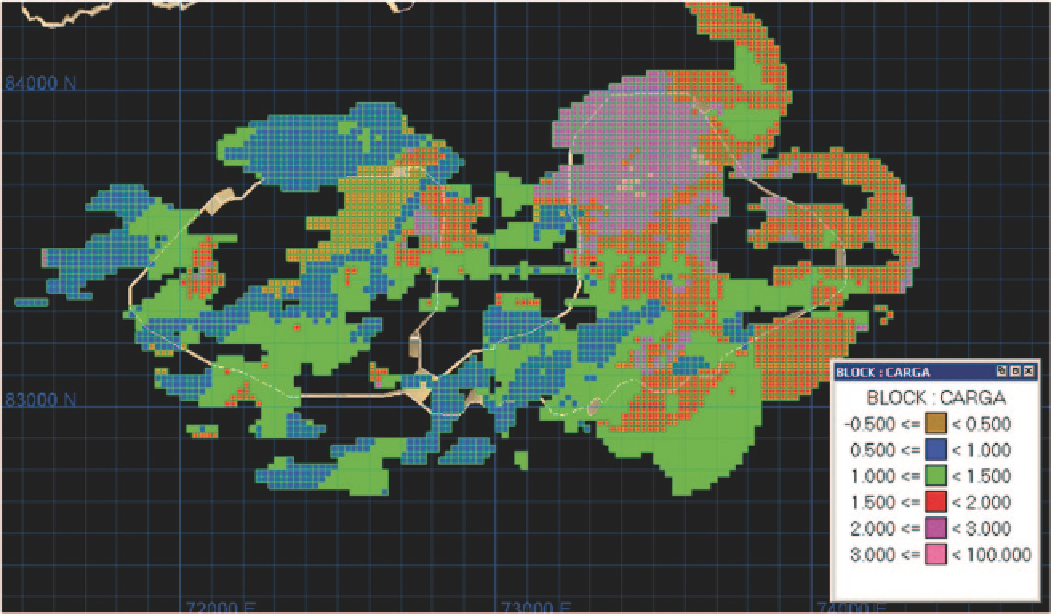
Fig. 14.27
Point load model, Bench 2400m
from comparing the two models by periods (month, year, and
global within the 80 m extraction volume). Based on these
comparisons, certain kriging parameters were modified, and
the resource model re-estimated. A number of iterations were
completed until it was decided that no further optimization
of the resource model was possible.
An assumption is made that blast holes models provide
a reasonable reference model for calibration. It can be ar-
gued that individual blast holes are less reliable than indi-
vidual composite samples, but in the case of a block model
this problem diminishes (as long as there are no significant
biases), due to the averaging of the individual blast holes.
Another important aspect of the calibration process is to
decide what an acceptable match of the reference model is.
In the case of Cerro Colorado, the following acceptance cri-
teria were used:
1. For comparisons on a monthly basis, at least 10 of the 12
months had to be within 10 % relative to the reference
model for tonnage and grade above economic cutoffs. For
these same months, variations of 5 % or smaller for metal
content were required as well.
2. For comparing the annual volume, the accepted devia-
tion was 5 % (relative) with respect to tonnage, grade, and
metal content above economic cutoffs, and applied on an
individual estimation domain (Domains) basis.
3. For the overall production volume, up to 5 % deviation
for tonnages and grades were defined as acceptable, while
metal content was required to be within 3 % for all and
each of the main mineralized units (Domains).
Table
14.10
shows, as an example, the annual comparisons
for each Domain for iteration #5 of the 2003 resource model.
The table shows grade, tonnage, and metal content of the Re-
source Model (“Model”), grade, tonnage, and metal content
of the blast hole model (“Reference”), and the relative differ-
ences, which are positive if the resource model is larger than
the reference model (overestimation). Observe how most of
the criteria described are met for the economic cutoffs. Some
of the Domains show very good comparisons (1 and 4, in
particular). The largest relative differences are found in Do-
main 6 (medium to low grade sulfides), but largely due to a
total of only 200,000 tons produced in the year, equivalent
to less than 2 weeks production, or about 20 blocks in the
resource model.
An important conclusion from this calibration exercise is
that it is possible to re-estimate immediate past production to
an acceptable precision with drill hole data only.
14.1.28
Statistical Validation of the Resource
Model
Whenever production data is available, validation of the
block model generally requires that (a) the resource model
is consistent with the assumptions and parameters applied,