Geoscience Reference
In-Depth Information
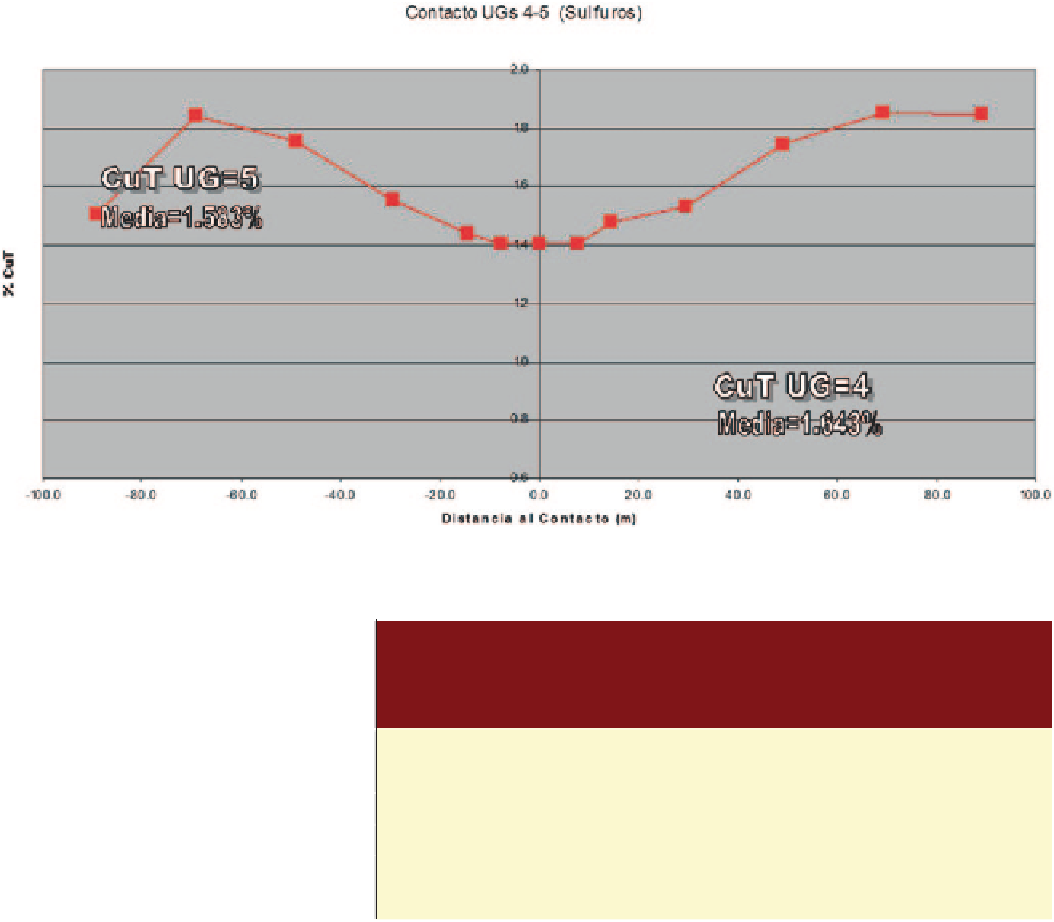
Fig. 14.19
Average grade profile at the contact between Domains 4 and 5
Table 14.7
Parameters of the
predicted SMU distribution for
the main units, discrete Gaussian
model
7&X
'RPDLQ
'LVSHUVLRQ
9DULDQFH
[[P
608
3UHGLFWHG
7&XPHDQ
608JUDGH
'*0RGHO
3UHGLFWHG
608
6WDQGDUG
'HYLDWLRQ
'*0RGHO
3UHGLFWHG
608&9
'*0RGHO
&9RIWKHP
'HFOXVWHUHG
&RPSRVLWHV
14.1.20
Predicted Grade-Tonnage Curves
for TCu, Cerro Colorado
definition of the SMU size, in the case of Cerro Colorado
as a 20 × 20 × 10 m block, for which, and based on the cor-
relogram models, a dispersion variance and a VCF can be
obtained; and (iii) the declustered 10 m composite database
for each Domain.
Table
14.7
shows the predicted CV (or target CV) for
each Domain and 20 × 20 × 10 m SMU size. Table
14.7
also
shows the dispersion variance of the blocks and the CV of
the original declustered 10 m composites.
As expected, the predicted CV corresponding to the SMU
distribution is lower for every Domain compared to the orig-
inal composites. For Domain 3, low-grade oxide mineraliza-
tion, the predicted SMU CV is lower, but fairly similar to
the original CV, an indication that there is little mixture of
grades within that Domain, evidenced by a highly continu-
ous correlogram model. The opposite can be said about the
higher grade units, such as Domain 4.
The predicted grade-tonnage curves from the DG-corrected
distribution were obtained for the mineralized units shown in
Table
14.7
. If these curves are similar to those obtained from
the estimated resource model, then it can be said that the
estimates incorporate an appropriate amount of volume-vari-
ance correction. However, it should always be remembered
that the within-block mixing of grades is only one source of
dilution and ore loss.
Figure
14.21
shows the grade-tonnage curve for the pre-
dicted SMU distribution and the original 10 m declustered
composites for Domain 1, higher-grade oxides. Note that the
tonnage above cutoff is expressed as a percentage of the total
meters of drilling above cutoff, such that a comparison can
be made. For a 0.5 % TCu cutoff, the DG model predicts


