Geoscience Reference
In-Depth Information
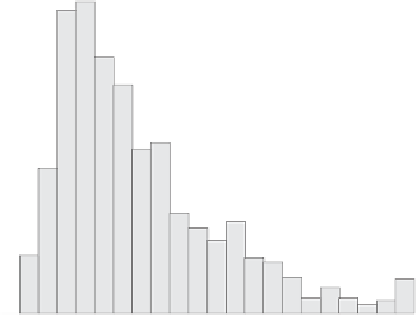
CuT, DTH vs Pozos, Oxidos <=4m
CuT. Cell Declus., UG=1
Number of Data 2457
mean 0.7711
std. dev. 0.6085
coef. of var0.7891
maximum7.7250
90th quantile 1.4809
upper quartile 0.9798
median 0.5920
lower quartile 0.3900
10th quantile 0.2660
minimum0.0190
5.00
0.160
4.00
0.120
3.00
0.080
2.00
0.040
1.00
0.00
0.000
0.00
1.00
2.00
3.00
4.00
5.00
0.00
1.00
2.00
3.00
Value
CuT, DTH
Fig. 14.14
TCu histogram and basic statistics of declustered oxide
composites
Fig. 14.16
Q-Q plot, TCu, DDH 10 m composites vs. blast holes, oxide
CuT. Cell Declus., UG=4
CuT, DTH vs Pozos, Sulf. <=4m
Number of Data
1413
5.00
mean
0.9648
std. dev.
0.6949
coef. of var
0.7203
0.120
maximum
7.4780
4.00
90th quantile
1.8829
upper quartile
1.2700
median
0.7840
lower quartile
0.4736
3.00
10th quantile
0.3120
0.080
minimum
0.0130
2.00
0.040
1.00
0.00
0.000
0.00
1.00
2.00
3.00
0.00
1.00
2.00
3.00
4.00
5.00
Value
CuT, DTH
Fig. 14.15
TCu histogram and basic statistics of declustered sulfide
composites
Fig. 14 .17
Q-Q plot, TCu, DTH 10 m composites vs. blast holes, sul-
fide
areas are of interest for infill drilling. The lower grade, mar-
ginal mineralization and waste units are more likely to be
drilled only in the initial drilling campaigns, which are more
regular.
Different types of drill hole data were compared separately
to blast holes, since the database contains diamond drill holes
(DDH), reverse circulation holes (RC), and open percussion
holes (DTH). Additionally, the analysis was done separating
oxide and sulfide mineralization. Three examples of the com-
parisons are shown in Figs.
14.16
-
14.18
. Blast hole data tend
to have higher grades, although the differences are small.
14.1.16
Comparison Between Composites
and Blast Hole Data
14.1.17
Contact Analysis
Blast hole data are used to select ore and waste and are sam-
pled on 10 m benches. There are several statistical tools that
can be used to compare two distributions (Chap. 2); howev-
er, the first major decision is which data should be compared.
A set of paired (“twins”) data was obtained by searching in
three dimensions for composites that are located a maximum
distance of 4 m from a blast hole. The resulting pairs can be
compared with a Q-Q plot.
The analysis of grade profiles across boundaries between
estimation domains is often referred to as contact analysis.
Its purpose is to understand which contacts are hard, in the
sense that grades on either side of the contact are very dif-
ferent, or soft, where the grade transition from one domain
to the next is smooth. An example of a hard contact in por-
phyry-type deposits is typically the interface of the leached