Geoscience Reference
In-Depth Information
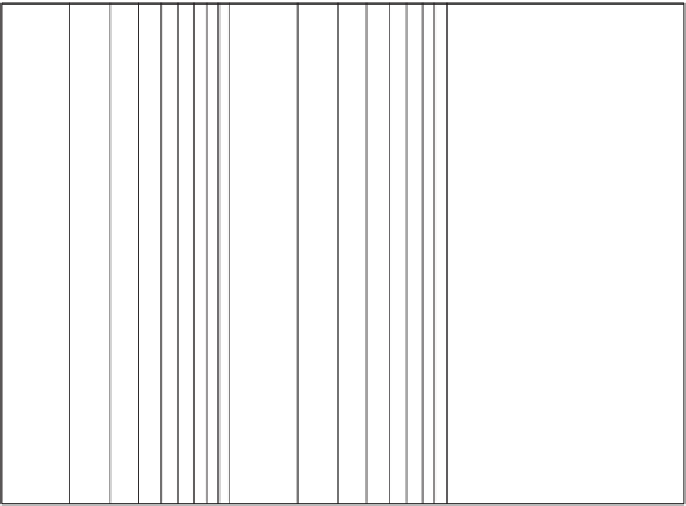
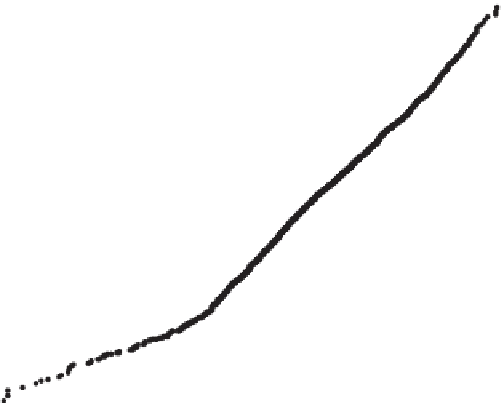
Fig. 14.12
TCu probability plot,
oxide composites
CuT, UG=1, Comps
99.99
99.9
99.8
99
98
95
90
80
70
5
60
40
30
20
10
5
2
1
0.2
0.1
0.01
0.020
0.20
2.0
20.
CUT
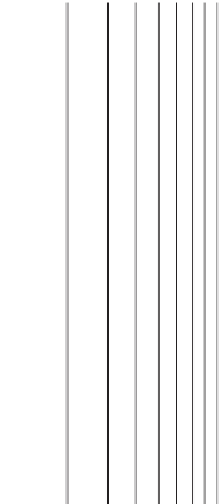
Fig. 14.13
TCu probability plot,
sulfide composites
CuT, UG=4, Comps
99.99
99.9
99.8
99
98
95
90
80
70
5
60
40
30
20
10
5
2
1
0.2
0.1
0.01
0.020
0.20
2.0
20.
CUT
cell was chosen as the optimal one for declustering, since it
corresponds to the initial pseudo-regular drilling grid.
Figures
14.14
and
14.15
show declustered histograms of
TCu for oxides (UG 1) and sulfides (UG 2) respectively. Note
how, in both cases, the statistics have changed significantly.
The declustered TCu mean of the first oxide unit (Domain 1)
is 0.77 % (Fig.
14.14
), compared to 0.86 % TCu for the non-
declustered data. In the case of the first sulfide unit (Domain
4), the declustered TCu mean is 0.96 % (Fig.
14.15
), while
the non-declustered mean is 1.20 % TCu. Generally, the
higher the grade of the estimation domain (UG), the more
severe the impact of clustering is. Logically, the high grade