Geoscience Reference
In-Depth Information
Fig. 14.9
Mineralization type section, 82230N, 2000 (
no fill
) and 2003 (
dotted fill
) geologic models
2000 model units do not have any fill. By observing simulta-
neously both models, the impact of the new drilling and the
quality of the interpretation work can be assessed.
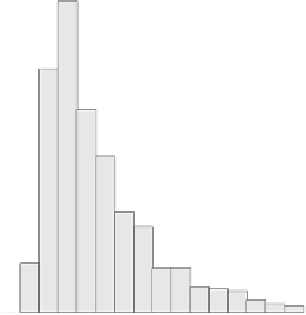
CuT, UG=1, Comps>=2m
Number of Data 2442
number trimmed 13365
mean0.8579
std. dev.
0.6574
0.200
coef. of var
0.7663
maximum
7.7250
90th quantile
1.7078
upper quartile
1.0920
14.1.15
Exploratory Data Analysis
0.150
median
0.6560
lower quartile
0.4320
10th quantile
0.2880
minimum
0.0190
14.1.15.1
Compositing
0.100
The original samples were composited down-the-hole at a
nominal 10 m interval. Down-the-hole composites were cho-
sen because some of the drill holes are inclined 60 ° or less
and bench compositing is not appropriate.
The original samples were back-tagged with the modeled
geology, and the 10 m composites obtained by breaking the
composites at the estimation domain contacts (UGs). This
resulted in a total 11,809 10 m composites, of which about
12 % are less than 10 m in length. After statistically verifying
that the length of the composite is not correlated with grade,
only 88 composites less than 2 m were discarded from the
database.
Histograms and basic statistics were obtained for TCu
and SCu for the different estimation domains. Figures
14.10
and
14.11
show that the grade distributions are fairly typical
of porphyry copper deposits.
The corresponding probability curves are shown in
Figs.
14.12
and
14.13
respectively. Note that both curves
show breaks and departures from a straight-line fit, which
may imply multiple populations.
0.050
0.000
0.00
1.00
2.00
3.00
4.00
CUT
Fig. 14.10
TCu histogram and basic statistics, oxide composites
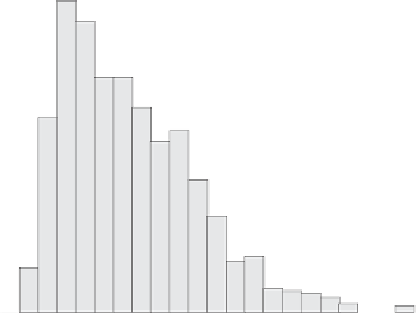
CuT, UG=4, Comps>=2m
Number of Data 1407
number trimmed14400
mean
1.1974
0.120
std. dev.
0.7495
coef. of var
0.6259
maximum
7.4780
90th quantile
2.1533
upper quartile
1.6456
median
1.0606
0.080
lower quartile
0.6184
10th quantile
0.3900
minimum
0.0130
0.040
14.1.15.2 Declustering
The drill hole data are spatially clustered as a result of the
historic drilling campaigns, and also due to the presence of an
underground tunnel, from which several holes were drilled.
Declustering techniques were applied (see Chap. 2) to obtain
an unbiased prediction of the global mean and also to estimate
the expected SMU-support grade-tonnage curves for each do-
main. The cell declustering method (Deustch
1989
) was ap-
0.000
0.00
1.00
2.00
3.00
4.00
CUT
Fig. 14.11
TCu histogram and basic statistics, sulfide composites
plied to the 10 m composites for each estimation domain. After
analyzing the results for multiple cell sizes, a 100 × 100 × 30 m