Geoscience Reference
In-Depth Information
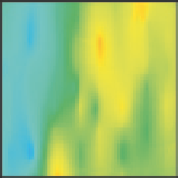
The Transfer Function
Kriged Orebody
Multiple Images
Transfer
Function
Transfer
Function
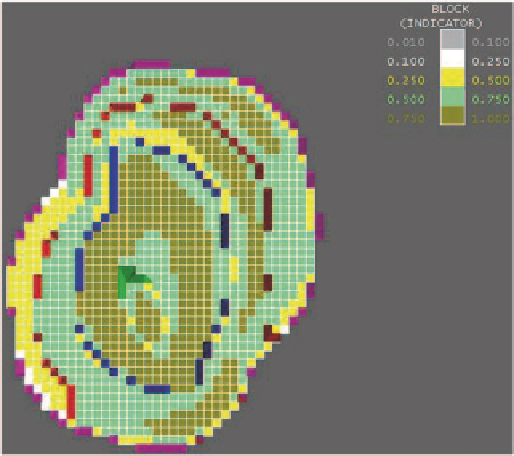
Fig. 12.3
Bench mining probability map. Blocks are coded by prob-
ability of being mined.
Magenta
,
blue
, and
maroon
colors indicate the
position of the intermediate and final mining walls. (From Van Brunt
and Rossi
1999
)
Single Response
No Uncertainty
Multiple
Responses
Producing a detailed mine design from an optimized pit
outline involves smoothing the outlines to provide minable
shapes, while deviating as little as possible from the optimal
outline. This process is manual, and the decisions made re-
garding the location and width of accesses, ramps, berms, and
other geometric parameters required to make the mining op-
erational can be significant. Probability maps by bench and
by phases can be used as guides during the final smoothing
and design of the pit and definition of the ramp positions.
Figure
12.3
(taken from Van Brunt and Rossi
1999
) shows a
bench map of the probability of each block being mined ac-
cording to the mine plan developed from the resource model.
Developing conditional probability maps such as the one in
Fig.
12.3
gives the mine planning engineer an advantage over
conventional planning. Risks resulting from highly variable
mineralization can be mitigated through the addition of inter-
mediate phases and modifying the position of the pit walls.
Also, these maps can be used to target additional infill drilling.
Grade control is an application where risk analysis is used
directly to make an economic decision. In this case, the con-
sequences of grade uncertainty are directly evaluated and
the optimal choice is made based on the maximum profit or
minimum loss choice.
The decision to recover and send to the mill or not a
certain panel in the open pit is typically based directly or
indirectly on grade estimates,
z
*(
x
). The loss function
L
(
e
)
(Journel
1988
; Isaaks
1990
; Rossi
1999
) is a mathematical
expression that attaches an economical value (impact or loss)
to each possible error, measured in, for example, dollars.
By applying a loss function to the conditional probability
Fig. 12.2
The Transfer Function for estimated and simulated models
at the appropriate grades can be assessed. From this assess-
ment, risk mitigation measures can be developed. The con-
cept is illustrated in Fig.
12.2
.
Sensitivity analyses are commonly carried out by mining
engineers. The impact of the commodity price or change in
the estimated grades is assessed. If the different commodity
price or grades result in significant changes in the designed
pit walls, for example, then the material in question may be
marginal. It is also important to identify areas of the pit that
are extracted to contain few erratic or highly uncertain zones
of mineralization. Engineers developing mine plans will usu-
ally consider simple sensitivity analyses, for example by ad-
justing the block model grades + 10 % and − 10 %. A similar
approach is used to analyze the sensitivity of the project to
metal prices, operating costs, and other relevant variables.
But there are no standard procedures for this purpose.
A full risk assessment requires that the complete un-
certainty model (all realizations) be processed through the
transfer function; this may involve a full mine planning ex-
ercise, including scheduling of ore through the mill for cer-
tain periods of the mine life (Jewbali and Dimitrakopoulos
2009
). In practice, certain shortcuts are possible, such as
processing only the best, worst, and most likely scenarios.
These shortcuts have their own pitfalls, including the criteria
to rank the realizations.