Geoscience Reference
In-Depth Information
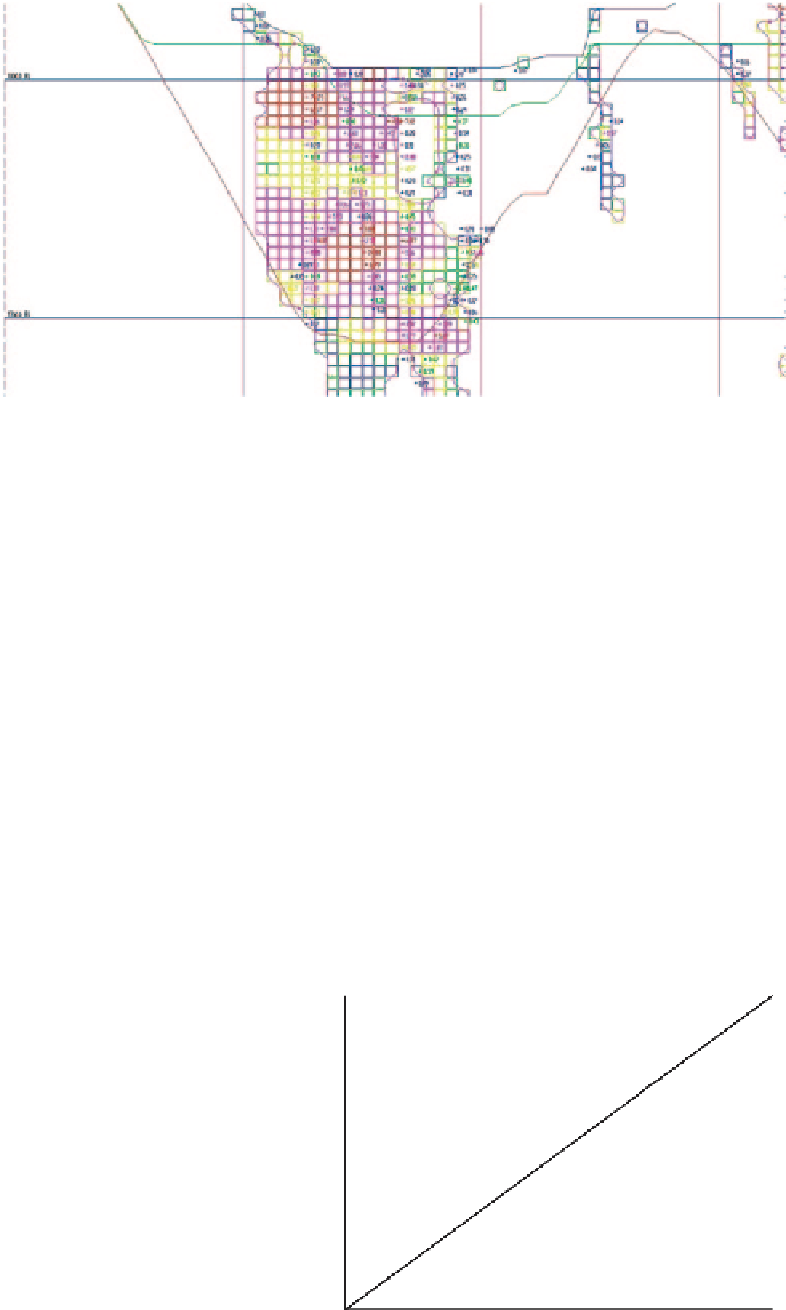
Fig. 11.8
Detail of a cross
sectional view showing color
coded model on 5 × 5 × 5 m,
5 m composites grades, and
mineralized zones. Also the
surfaces corresponding to
topography at the time of
modeling, and predicted final
pit are shown
Difference Au, g/t
Number of Data 781009
number trimmed443061
mean -0.0231
std. dev. 0.2877
coef. of varundefined
maximum5.5270
upper quartile 0.0280
median -0.0040
lower quartile -0.0630
minimum 5.4050
nal, and should be considered part of the final documentation
regarding the resource model.
0.400
0.300
11.5
Comparisons with Prior and Alternate
Models
0.200
It is always necessary to compare updates with prior models,
a visual example of which was shown in Fig.
11.7
. The com-
parison is useful for both operating mines and development
projects, since the resources and reserves of any deposit
evolve over time because new drilling changes the informa-
tion available and the quality of the models, and also because
the operation is mining out portions of the deposit.
The comparison between models must be done ensuring
that the portions of models compared are relevant to each
other. For example, care must be taken if the definition of
the estimation domains has changed from one model to the
next; if the selectivity of the mine or dilution conditions
have changed; or if the economic cutoff of the operation has
changed with time. These aspects will impact not only the
methodology used to estimate the updated resource model,
but also its reporting and documentation.
Figure
11.9
shows the histogram of the differences in gold
grades (in g/t) between two blocks models, prior and updat-
ed, on a block basis. A negative difference means that the up-
dated model has lower grades. In this case, there is little dif-
ference between the two. Notice how the histogram quickly
highlights the blocks where the differences in grade are most
extreme (the maximum and minimum, and the 25th and the
75th percentiles). These blocks can be identified in space and
the reasons for the significant differences fully understood.
Another numerical example is shown in Fig.
11.10
, where
the Q-Q plot of two models for the Escondida mine (charac-
terized by their development date) is shown. Note that this
and most other numerical comparisons are most useful when
comparing corresponding estimation domains. In the case of
0.100
0.000
-1.50
-0.50
0.50
1.50
Difference, Prior vs Updated Models, Au (g/t)
Fig. 11.9
Histogram and basic statistics of the differences between two
block models, Au grade in g/t
TCu Feb.2000 vs Dec.2000 Models
6.00
5.00
4.00
3.00
2.00
1.00
0.00
0.00
1.00
2.00
3.00
4.00
5.00
6.00
TCu Feb. Model
Fig. 11.10
Q-Q plot of the February and December resource models,
Escondida, Supergene Sulfide estimation domain, structural blocks 1
and 2