Geoscience Reference
In-Depth Information
Question 2:
Derive the simple kriging equations by taking
the derivative of the estimation variance with
respect to the weights. Explain why the krig-
ing weights do not depend on the data values
and why this is important. Explain why krig-
ing is unbiased and exact.
Question 2:
Plot grade tonnage curves for the distribu-
tions of question 1 and see which one most
closely matches the grade tonnage curve
from volume variance (if those results are
available). Comment on the application of
this procedure in practice.
Question 3:
The covariance between the simple kriging
estimate at an unsampled location and the
data values used in kriging is correct, that is,
the covariance model used in kriging. Dem-
onstrate this result. Demonstrate that this
result is
not
true for ordinary or universal
kriging. Would the covariance be too high or
too low with ordinary kriging.
8.7.4
Part Four: Kriging a Grid
Question 1:
Set up to estimate a reasonable grid using
largedata.dat
. Create a 3-D model with
stationary simple kriging with a discretiza-
tion of 1 × 1 ×1 (this most closely approxi-
mates what will happen in simulation).
Question 4:
Derive the variance of the kriging estimate
Va r
{
Y*
(
u
)} and express the result in terms of
the kriging variance. Comment on the impor-
tance of this result relative to the smoothness
of kriging.
Question 2:
Evaluate the results of your kriging: (1) plot
some sections or visualize in 3-D checking
that the map looks reasonable and that the
original data are reproduced at their loca-
tions, (2) compare the histogram of the esti-
mates to the original data, and (3) compare
the variogram of the estimates to the original
data. Many of these evaluations will have to
be done on a by-rock-type basis. Comment
on the results.
8.7.2
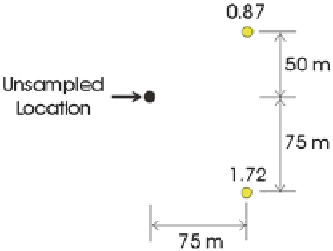
Part Two: Kriging by Hand Question
Consider the configuration to the right. The global mean is
1.3 and the variance is 0.2. Calculate the simple kriging esti-
mate at the unsampled location given that the isotropic cova-
riance function C(h) = exp( − 3h/275). Show all steps clearly.
Question 3:
Create a model with ordinary kriging and
compare the results to the initial simple
kriged model. Investigate how the variability
of the block estimates depends on the number
of data used (particularly for a small number,
say, 4).
Question 4:
Create a model with block kriging by dis-
cretizing the cells by at least 9 points. Keep
all other parameters comparable to a run
that you have constructed. Comment on the
results.
References
8.7.3
Part Three: Conditional Bias
Aitchison J (1986) The statistical analysis of compositional data:
monographs on statistics and applied probability. Chapman and Hall,
London, p 416
Baafi EY, Kim YC (1982) Comparison of different ore reserve estima-
tion methods using conditional simulation. AIME annual meeting,
Preprint, pp 82-94
Boyle C (2010) Kriging neighbourhood analysis by slope of regression
and weight of mean—evaluation with the Jura data set. Min Technol
119(2):49-58
Chilès JP Delfiner P (2011) Geostatistics: Modeling spatial uncertainty,
2nd ed. Wiley Series in Probability and Statistics, New York, p 695
Delfiner P (1976) Linear estimation of non-stationary spatial phenom-
ena. In: Guarascio M, David M, Huijbregts CJ (eds) Advanced geo-
statistics in the mining industry. Reidel, Dordrecht, pp 49-68
Deutsch CV (1994) Kriging with strings of data. Math Geol 26(5):623-
638 (November)
A serious problem with kriging is conditional bias. Use the
largedata.dat
data to experiment with conditional bias
in cross validation mode.
Question 1:
Set up to cross validate the
largedata.
dat
data. Consider ordinary kriging with a
search radius equal to the variogram range.
Vary the number of data between 2 and 40
(consider 2, 4, 8, 16, and 40), plot the cross
plots of true versus estimate, it linear regres-
sion lines, and plot the slope of the regression
line versus the number of data used for krig-
ing. Comment on the results.