Geoscience Reference
In-Depth Information
Figure
6.9
shows another example of a Cu correlogram,
taken from the El Pachón Project, in the Argentinean Central
Andes, currently owned by Xstrata Copper. It shows three
main directions of anisotropy, a variogram map showing
in plan view the NW-SE main directions, and the summary
model below. The experimental correlograms were fitted
with three spherical structures, with the model been almost
twice as continuous in the main direction of continuity com-
pared to the other two.
Regardless of its final form, the model should always be
checked by viewing directional variograms in several inter-
mediate directions; that is, the 3-D model obtained based on
a few directions should represent accurately all possible di-
rections.
6.3.3
Goodness of Variogram Fit and Cross
Validation
A good deal of research has been dedicated to fitting the var-
iogram models and measuring their quality. Different mod-
els can fit the same experimental data, so it is natural to ask
which model is better. The tendency is to search for objective
(statistical) measures of goodness to judge a model that is to
a large extent subjective.
One common statistical measure is weighted least-
squares, whereby the distance from each modeled point to
the corresponding experimental variogram value is measured
and minimized. This is commonly used in software that pro-
vides an automatic or semi-automatic fit. The weights can be
proportional to the number of pairs for each lag, the number
of informed values for each direction, or a scheme that as-
signs more weight to the first few lags of the model (Cressie
1985
; Isaaks
1999
).
While it may be useful to have a measure of closeness be-
tween the model and the experimental data, there is no guar-
antee that the lowest sum of squared differences would yield
a better model. A good fit of important features of variogram
models such as the nugget effect, anisotropy, and short-scale
structure may not, in fact, lead to minimum squared differ-
ence. A good practice is to fit the nugget effect with a down
the hole variogram, then impose that nugget effect on the
variogram model in other directions. This will generally
make the least-squares measure worse, not better.
Cross validation is sometimes performed to compare al-
ternative variogram models. The comparison is done based
on the results of the final objective, which most often is
some kind of estimation. The exercise consists of estimat-
ing locations with known sample values, and comparing the
estimated and the sampled value; the alternative variogram
models would result in different sets of estimates; the bet-
ter variogram model would be the one that yields a lower
average error. The are two ways that this exercise can be
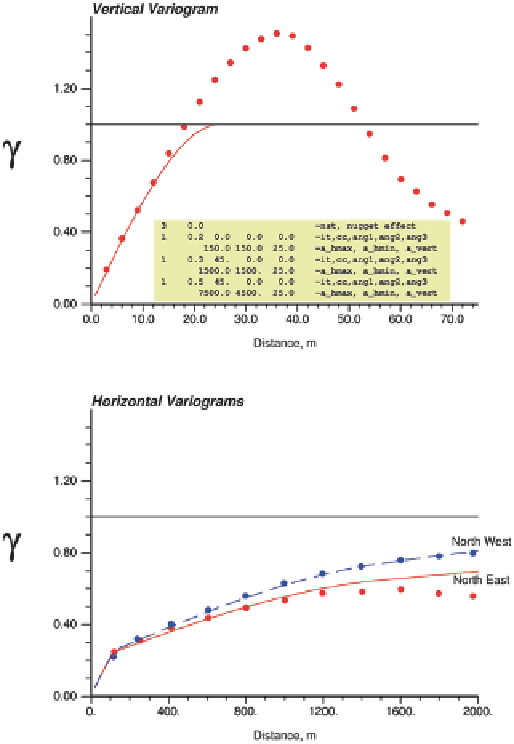
Fig. 6.8
Example directional variograms and fitted models from a
Northern Alberta Oil Sands mine
Figure
6.8
shows vertical and horizontal standardized
variograms of the mass fraction of bitumen from an oil sands
depsit in Northern Alberta. The area of interest is approxi-
mately 5 × 5 km, and about 100 m thick. The vertical vario-
gram at the top of the figure shows a relatively short vario-
gram range of 25 m, a trend above the sill and then a drop
below the sill. The trend/cyclic behavior is a result of the
bitumen grade being lower at the top and the bottom of the
formation. The horizontal variograms are nearly isotropic;
however, the North East directional variogram shows greater
continuity at large scale than the North West directional var-
iogram. The variogram model parameters are shown on the
vertical variogram plot. No nugget effect and three spherical
structures were used to fi the variogram. The structures ex-
plain 20, 30 and 50 % of the variance, respectively. The verti-
cal range for all structures was fixed at 25 m. The horizontal
ranges are isotropic at 150 m and 1,500 m for the first two
structures and anisotropic at 7,500 and 4,500 for the North
East and North West directions for the last structure. The fit
to the points is considered good despite the fact that the verti-
cal trend is not fully represented in the vertical variogram.